Further doubt has been cast on the widely-broadcast alarmist temperature claim that last year was the hottest since records began. A deep dive into figures published by the U.S. National Oceanic and Atmospheric Administration (NOAA) reveals that the ‘hottest ever’ claims did not apply to large areas of the world including Asia, Europe, North America, Oceania, East N. Pacific, Hawaiian region, Arctic and Antarctic. Investigative science writer Larry Hamlin notes in the science blog Watts Up With That? that at least 58% of the Earth’s land surface where 73% of the world’s population lives did not experience the hyped ‘highest ever recorded’ average temperature anomaly.
Hamlin charges that NOAA’s characterisation that the 2023 global average temperature anomaly was the “highest ever recorded” misrepresents the global reality of widely varying average temperatures anomalies across many disparate global climate regions. Furthermore, he notes, alarmists exaggerate global anomaly outcomes by claiming they represent a “global climate emergency” where “temperatures during 2023 likely exceed those of any period in the last 100,000 years”. All this “ridiculous” climate alarmist propaganda is based on an increased anomaly difference of 0.15°C from the year 2016.
Hamlin states that 2016 was a very strong El Niño year, as was 2023. In fact if one looks at the accurate satellite record, it can be observed that heat increases over the last 25 years are mainly confined around strong El Niño years, suggesting natural influence rather than human-produced carbon dioxide is responsible for any observed warming. In the absence of El Niño events, the climate record over the last two decades has been notable for long pauses in temperature. In addition, the 2023 temperature record may have been affected by the January 2022 Hunga-Tonga submarine eruption that suddenly boosted water vapour, a powerful if short-lived ‘greenhouse’ gas, by 13% in the upper atmosphere. There is no doubt that last year was warmer than usual, but varied temperature movements are tiny on any long-term basis, obviously affected by natural influences, and well within any reasonable margin of error. In the next 12-24 months, they could just as easily come tumbling down.

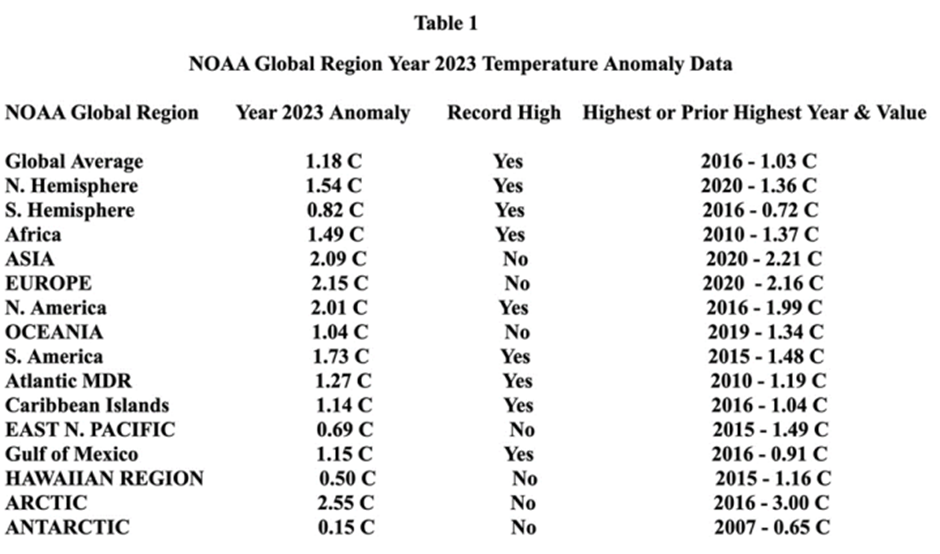
The above table shows the wide differences in 2023 temperature anomalies across the planet. Warming has been almost non-existent in Antarctica, but land areas with ever-expanding urban areas often produce the highest anomalies. The global anomaly rise of 1.18°C corresponds to a temperature of 15.08°C, and is relative to a NOAA 1901-2000 baseline average of 13.9°C. Cue for catastrophist’s alarm is the three 20ths of a degree centigrade increase from the previous higher figure in 2016, an amount well within any margin of error, and as we shall see, unmeasurable with any convincing accuracy.
Eagle-eyed readers will have spotted that Hamlin counts North America as having ‘No’ record high given its miniscule claimed 0.02°C rise from the El Niño year of 2016. He has a point – such a claimed rise is unmeasurable, and when the ‘climate collapse’ stakes are high it can be regarded as scientifically unsound. There is simply too much doubt surrounding the collection of surface temperature data by a number of weather operations including NOAA and the U.K. Met Office. Dr. Roy Spencer from the University of Alabama in Huntsville, one of the scientists behind the accurate UAH satellite temperature record, recently published a paper that found the urban heat effect was responsible for 57% of the warming in the U.S. since 1895 averaged over all suburban and urban stations. This might not surprise given that in the U.K., the Met Office claimed a record high temperature of 40.3°C on July 19th 2022 from a measuring device halfway down a military runway. At around the time of the 60-second spike, the runway was in use by three Typhoon fighter jets. The Met Office runs a global temperature dataset called HadCRUT, and over the last decade it has added 30% extra warming to the recent record on a retrospective basis.
Hamlin also casts further reasonable doubt on the U.S. figure by publishing the graph below taken from U.S. Climate Reference Network (USCRN) database.

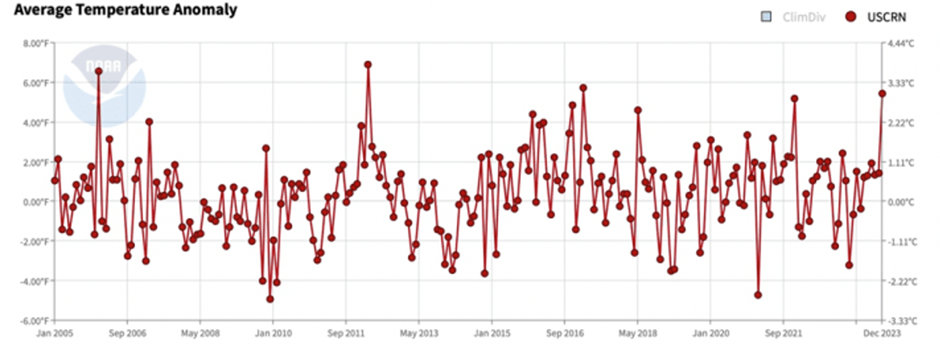
The rarely-referenced USCRN was set up by NOAA in 2005 using around 114 carefully sited temperature measurement stations across the contiguous U.S. in areas well away from urban development. As can be noted, very little warming can be seen over nearly two decades. Hamlin states that there is no increasing average temperature anomaly trend in the U.S. with the 2023 outcome exceeded by numerous years including 2016.
As the Daily Sceptic has noted in the past, accurate temperature measurement barely got stated before 1900, and widespread media claims that 125,000-year records are being broken are little more than wishful thinking by those seeking to collectivise society using the Net Zero weapon. General past trends in temperature can be discerned using proxy evidence, and this all points to much higher warming in recent times. Notably, as the planet emerged from an ice age, it is the view of many scientists that temperatures were between 3-5°C higher across many parts of the world between 8,000-5,000 years ago. It is very likely that the current ‘boiling’ temperatures are very similar to those found in both the Medieval and Roman warming periods.
Chris Morrison is the Daily Sceptic’s Environment Editor.
To join in with the discussion please make a donation to The Daily Sceptic.
Profanity and abuse will be removed and may lead to a permanent ban.
$cientism. Fear mongering. As Chris states, temp reading stations maybe date from 1880 in a few locations, with even today most of the world untouched by digital measurements. Follow the money. Bird Choppers, solar tanning beds, the EVs, the money, the fraud, the graft, the greed, the $ Trillion pa. climate mafia.
Let’s not discuss NOAA et al fiddling and changing the numbers, or Climate Gate, or non-scientist Mann with his $1 million pa salary trying to eliminate the medieval ice age and warm periods with his fraudulent tree ring circus to quote Steyn.
We are just climbing out of the coldest epoch in millennia – the medieval cooling period which ended ~1800. One would expect a ‘warming’ from that historical low, but we are still below normal historical averages – and none of this has anything to do with plant food.
https://archiv.klimanachrichten.de/temperatures-over-the-past-10000-years/
Climate bollocks – same tactics and propaganda as the Rona bollocks.
Well put! I think the temperature readings taken in the 1880s would have been more accurate than todays measurements as there was less urban sprawl, meaning, less tarmac/concrete etc but more grass and open areas in towns and cities to site met stations! So the readings then would be lower, meaning a slow and steady artificial increase since then due to urbanisation
Temperature data sets such as NOAA, Gistemp, HadCRUT and so on supposedly take into account UHI (urban heat island effect) – but the adjustments can be questionable (and I’m being kind). This is why the USCRN data are so interesting.
NOAA themselves confirm that “the stations are placed in pristine environments expected to be free of development for many decades. Stations are monitored and maintained to high standards, and are calibrated on an annual basis.”
To my mind the USCRN dataset is the most credible – and funnily enough – as the above article states, shows little / no warming.
But the thermometers used were never designed for accuracies of tenths of a degree like what is being claimed today. Plus we never had thermometers all over the planet recording temperatures. They were mostly located in wealthy western countries like the UK and US and there were none in the oceans covering 70% of the globe.
Possibly more accurate but the victorians made some very solid precision equipment at the time and I’ll bet most of it still works today!
It was only after 1979 that we started to get more accurate data from satellites which cover the whole planet (except the poles) Before that the temperature data is extremely unreliable. The same thermometers were sitting in fields at one time and roads and buildings were gradually built up around them over time. The temperature record of earth really is a dog’s breakfast of adjusted and manipulated data.
Indeed. Last summer I attended a fascinating talk by a paleoarchaeologist who noted that we’re still coming out of the last ice age 11,700+ years ago and that all such periods are marked by intermittent warming/cooling periods. As well as the core samples your link discusses, such phases are also evidenced by animal fossil deposits (as herd animals migrate with the temp, so predators and other opportunists follow, etc).
Amazing how the planet managed before the UN, WEF, JSO and other climatistas, isn’t it?
4.6 billion years of evolution but according to Greta, UN and WEF we only get till a week next Tuesday to save the planet!
Which was the revised date after the previous date passed without incident…?
Technically, we are still in an Ice Age, as there are two major icecaps extant – Antarctica and Greenland. And we are following the same pattern as the last three or four interglacials, quite rapid warming, then gradual cooling interspersed with warm periods, each COOLER than the last. Viz. Image1
Also, obliquity is now moving us into cooling, and add to that, the PDO and AMO are booth moving into cooling phases, and … well, you get it, I am sure!
I am pretty sure that NONE of the models take into account any of the three distinct cycles Milankovich noted(11k, 41k and 100k, or indeed the Bray and Eddy Cycles. Or solar activity, which we now know has a strong effect on cloud formation
We are actually still in the ice age (Pleistocene) and this warmer period is called an Interglacial (Holocene) that happens in the middle of every ice age. —–You made good points, but the climate establishment are not interested in natural changes to climate or temperature, unless they seem back up the polemic.
All you need to know..
Jeremy, You couldn’t send me a clearer copy of this graph, could you? (shersleyken@gmail.com)
Grateful if you could…
It would be a tall order to get the average temperature of your house over the last 100 years, never mind the planet. You would need thermometers everywhere and be reading them every minute of the day. You would need one by the radiators, by the draughty windows, under the dog and cat, in the fridge, on the carpet where the sunbeams stream in etc etc etc. ——-Then when you managed to achieve all of that over one hundred years, you would then have to come up with some average or other. Do you choose the mean the median or the what? How do you know what average to use? Then once you create some average or other the number you end up with isn’t even a temperature, it is just a mathematical construct. How absurd would it be to claim the temperature of your house has risen by 0.8C since 1924? Then you would need to ask what temperature was my house before I started recording temperatures. ——The problem with temperature is that it isn’t an amount of anything. It is just a condition. Some things lose their meaning when you average them and temperature is one of those things.
The red thumbs down person will now explain to all the readers what “Global Average Temperature” is and how it is calculated. —-tick tock tick tock
ha ha ha jeez———–So confident in your opinion all you can do is do a red thumbs down and then runaway with your tail between your legs.
I think we already worked out that the people who promote this nonsense are materially incentivised to look for, and highlight in hysterical tones, any anomalies that favour their poorly thought out hypothesis.
Or, they are the ‘true believers’ who have swallowed this horse shit hook,line and sinker, (to mix a metaphore), and follow Climate Change like every macro change is a ‘sign from God’ that we have angered Him. Indeed, as 70% of the world chooses to ignore this bunkum, we must atone for their sins also, and that we should prostrate ourselves upon the earth and beg for forgiveness, and heat pumps, or starvation, and a grubby death.
Something like that.
Neil, Nice bit of dark ironic British humour. Meanwhile, I’ll keep sinning…throw another log on the wood burner please.
“and a grubby death`”
No grubs for me thanks – I’ll stick to my rare steaks, bacon and racks of lamb.
I prefer your menu…
Enjoy while you still can, because the direction of travel is not pretty.
Once again, Chris, you have nailed together much of the information into a well-written and coherent argument against the crazy Global Boiling rubbish. Thank you for bringing awareness to us of the Hamlin work, for a well-researched and thorough look behind the statistics spouted by the MSM. In particular, the 125,000 year record was just so stupid…did the woolly mammoths have thermometers??? Eh??? Heavens preserve us.
Glad that there are some proper scientists at NOAA (ref the USCRN database)…always an institution that I have admired but seems to have drunk the Kool-Aide. Having spent several years in a hurricane hotspot I was always grateful for their clear and well presented warnings, satellite imagery, and no “we’re all doomed” hyperbole. The Met Office should hang their heads in shame. I recollect you mentioning about the Typhoon jets in a previous piece – that stuck in my memory. You should write a book …
The Met Office weather forecasts have progressively got worse over the last few years. They can’t even get the weather right for the day ahead let alone tell us what’s going to happen in 50 years time. I’ve almost got to the point where I don’t even bother checking the weather because it’s more often than not wrong.
As someone quite close to me always says -“just take a look outside”…..succinct and usually very apposite. I also look closely at my collection of pine cones….
Today their Atlantic chart is definitely wrong compared with current satellite radar and looking out of the window!
Has Neil Furguson been tampering with their supercomputer perhaps?
Quick question: what is the global temperature right now?
‘ish.
I DON’T KNOW BUT IT’S NOT THE CORRECT ONE!
BIGOT!
RACIST!
LITERALLY HITLER!
OIL SHILL!
GRETA’S CHILDHOOD KILLER!
I KNEW SOMEONE WHO DIED IN A WILDFIRE AND HIS GRANDMA WAS CARRIED AWAY IN A TORNADO!
The Nut Zero fanatics will not be able to give you a figure, but they will tell you that whatever the figure is, it’s higher than it used to be and this is because of “carbon”.
I can consult the temperature of pretty much any place on earth these days and at the very least get an answer which will be pretty accurate within a reasonable range. It will be useful information too. It will give me an idea of the kind of clothing I might want to wear.
But with all the ranting about the temperature of the planet there doesn’t seem to be an obvious place to go look it up. I mean, if they can tell me what it was for the whole of last year (and amazingly even a hundred years ago), they should be able to tell me what it is is right now.
Perhaps there is a place but it’s not well publicised.
Perhaps they don’t want to draw too much attention to the real time temperature of the planet as it risks more people asking what the hell that means and how do they know. And those are pretty awkward questions for the thermostat theory proponents.
Reminds me of Ian Gillan’s exhortation to the crew at the desk when he complained he could not hear himself during a DP Mk 2 televised concert – “Lets have everything louder than everything else”…..he has a way with words for sure.
The earth doesn’t have a temperature. —-Unless we think that scientists just stick a thermometer under the earths armpit.
Hellish hot, hot, warm, cold, bloody cold, brass monkeys cold ‘ish.
I can’t find a way of averaging all that. Oh well, I’ll leave it to Mann to do that as he sees fit.
lets say we take the temperature in Sydney and simultaneously take one in Iceland. You can then add the two temperatures together to create an “average”. But this number is not the temperature of anything. It is just a statistic. ——If we do the same thing next week and this statistic has gone up what does it tell us? The answer is NOTHING. It says nothing about temperature because the number isn’t a temperature.
https://www.conservativewoman.co.uk/the-climate-scaremongers-heat-pump-fiasco-will-cost-us-all-dearly/
Chris Holmewood at TCW with a run down of heat pumps and the hottest year since God created the planet – well a long time anyway.
Let’s never forget we are at war with a bunch of treasonous w#nkers who only exist to destroy this country.
I’ve just been working next to some heat pumps for an average family bungalow. They were running constantly not sure how they could possibly be more energy efficient than a combi. Cold, still and cloudy couldn’t figure out what was powering them apart from good intentions and virtue signalling.
There was a fascinating comment following this article (thanks to Pretty Polly). I’d just love to see the “Connections Chart” for this nest of vipers (sorry it’s long but look at all those familiar names that I’ve highlighted!:
The Dept of Energy Security and Net Zero takes advice from the Climate Change Committee which George Soros’ very close friend, Gordon Brown, created as a result of the Climate Change Act 2008. This Act of Parliament has huge quantities of Soros’ money behind it with payoffs for Tony Blair, David Miliband (who did the groundwork) and David Cameron whose Con Party voted for it. Brown also created the Carbon Trust in 2000 and clearly still runs both.
According to the Guardian, Lord Willets is a frontrunner to be the new chairman of the Climate Change Committee. This will be highly significant if it happens because Lord Willets holds a position at the Resolution Foundation financed by Clive Cowdery who is a director of George Soros’ Institute for New Economic Thinking. Until recently, Cowdery was also a director of Soros’ Best for Britain.
Just by an astonishing random “coincidence”, the first chairman of the Climate Change Committee was Lord Adair Turner who was later chairman of George Soros’ Institute for New Economic Thinking.
Steven Fries, who is a current member of the Climate Change Committee, is a senior fellow of George Soros’ Institute for New Economic Thinking.
Piers Forster, current acting chair of the Climate Change Committee, is an ”agenda setter” at the World Economic Forum just like George Soros.
The CEO of the Climate Change Committee, Christopher Stark, benefits from a gravy train pay grade and previously worked for George Soros’ close friend Gordon Brown who was publicly congratulated by Soros at the G20 in 2009 for saving the world financial system with the words ”this was Gordon Brown’s finest hour”. Other members of the Climate Change Committee also have Soros connections.
The Carbon Trust was started in 2000 by Gordon Brown (probably desired by Soros who was working with Blair and Brown from 1997) and financed by Brown’s Climate Change Levy. So it seems entirely appropriate that Gordon Brown’s loyal assistant from the Treasury, Christopher Stark, will become the new CEO of the Carbon Trust in April 2024 and maintain George Soros’ climate policies just as he did as CEO of the Climate Change Committee!
Extensive homework you did there—-Well done.
I confess t’was not me…but Pretty Polly over on Conservative Woman (see Huxley Piggles link above). I was just stunned by this grim list of WEF stooges and how their tentacles spread far and wide that Polly had dug up.
Sahara green and verdant when much warmer 5k years ago
https://dailysceptic.org/2024/01/19/2023-was-not-the-hottest-year-on-record-for-over-70-of-the-worlds-population-data-show/
Warmer when Vikings could farm far more of Greenland than now
Warmer when Hannibal got his elephants over the Alps
Warmer when the Romans could grow red grapes in Norther England.
Not only do they lie, they think we are dumb.
The Sahel is greening now. People starve when the planet is colder, not warmer.