
In recent years just shy of 60 million have died globally each year. Our World in Data reports that in 2021 about 3.5 million people globally died from Covid.
Imperial College London’s claim that 20 million people were ‘saved’ during 2021 by the rollout of the vaccines has been repeated across the media and by governments worldwide; most people accept this as a ‘fact’. It’s a fundamental part of ‘the Narrative’.
Add 3.5 million ‘Covid’ deaths to the 20 million ‘saved’ from a Covid death and you have 23.5 million ‘Covid’ deaths that Imperial et al. anticipated would have occurred in 2021 sans the vaccine. That’s more than 40% of all global all-cause deaths!
Let’s just subject Imperial’s claim to a quick ‘sniff’ test. For just three weeks in mid-May 2020, before the arrival of any vaccines or much by way of therapeutics at all, cumulative all-cause excess deaths in the U.K. (according to the Hallett Inquiry, one of the worst hit countries) reached a peak of 20% (Figure 1). The figure then fell back to around 10%.
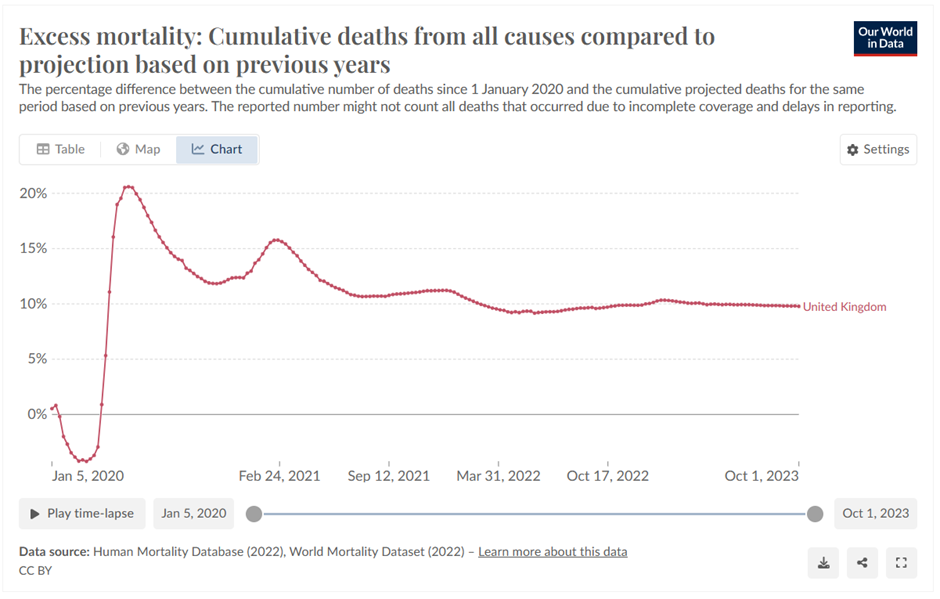
Of course, in 2020 we faced a novel(ish) virus with a naïve(ish) population. Even so, at no point did cumulative excess deaths in the U.K. approach anywhere near the 40% that Imperial’s research suggests would have been maintained across all countries, sustained for a whole year!
Estimates of total deaths linked to World War Two tend to be in the region of 70 million. Over the six years of the war this equates to about 12 million per year. Imperial’s claim that vaccines averted 23.5 million Covid deaths in 2021 would have you believe that, had it not been for the vaccines we would have seen twice the WW2 annual fatality level in 2021.
If you think you’ve read a recent article by me covering this same topic you’d be right. However, I missed some key data, which I hope this article will make up for.
My previous article made something of a ripple on social media, with Toby’s tweet of it reaching around 70,000 people.
It generated lots of comments. One came from Stephen Janitor, who pointed out that I should have set Imperial’s claim against global all-cause mortality to illustrate just how ludicrous it truly is. He was so right!
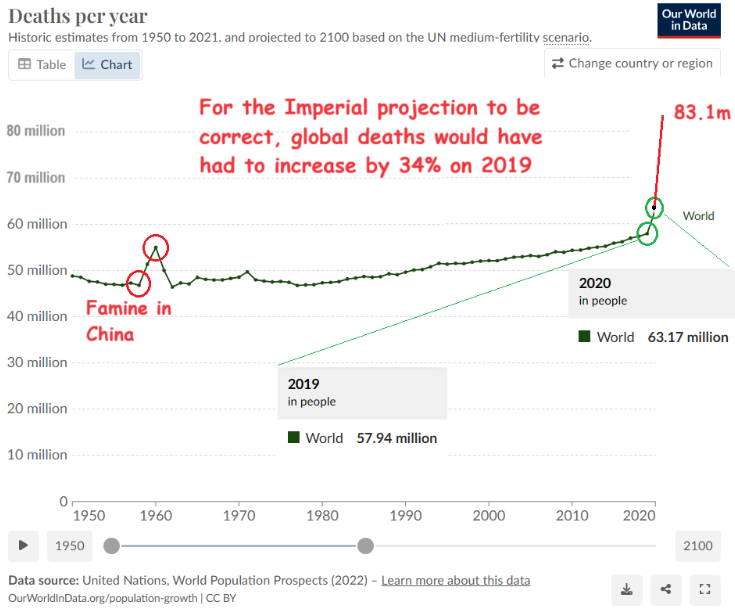
Figure 2 comes from Our World in Data (I’ve doctored the 2021 figure in line with the implied Lancet estimate). It shows that in 2019 global deaths totalled 58 million. In 2020 OWID show deaths at 63.2 million, an increase of 5.23 million. Interestingly, OWID attributes just 1.94 million deaths to Covid in 2020. So, what caused the other 3.29 million excess deaths? Lockdown? 1.6 excess non-Covid deaths for every ‘Covid’ death – how’s that for an instant cost-benefit analysis? Definitely one for an inquiry to look into some time.
I knew of two people personally who died of or with Covid. One was in his 90s, living with cancer and despairingly depressed from being locked in his room in a ‘care’ home. The other was over 70 and suffering from mesothelioma.
In the U.K., in round numbers, 10 people in a 1,000 die each year; in 2020, 11 people in a 1,000 died.
World War Two isn’t the only comparator worth considering. Looking at Figure 2 you’ll see I’ve circled a spike in global deaths back around 1960. This shows the impact of the great famine in China. You’ll have seen newsreels and read about it. It was truly horrific. In fact, so horrific that from 1958 to 1959 deaths in China increased by about, you guessed it, one third (33%) – lower than the 40% figure implied by the Lancet globally for 2021. Deaths increased again in 1960, before plunging back down to normal levels by 1962. We all lived through 2020 without vaccines; did it feel like we might imagine China to have been like in 1960? Thank heavens Mao didn’t emulate Rishi and introduce a Chinese version of ‘Eat Out to Help Out’ in late 1958, can you imagine what horrors Hugo Keith K.C. would conjure up that this would have led too?
I made the point in my previous article that the global vaccination rate at six months into 2021 was only about 10% and by the time vaccination could have had any impact at all only about 50% of the global population had been jabbed. However, in Africa the figures were less than 2% at the six month stage and only 10% at the end of 2021.
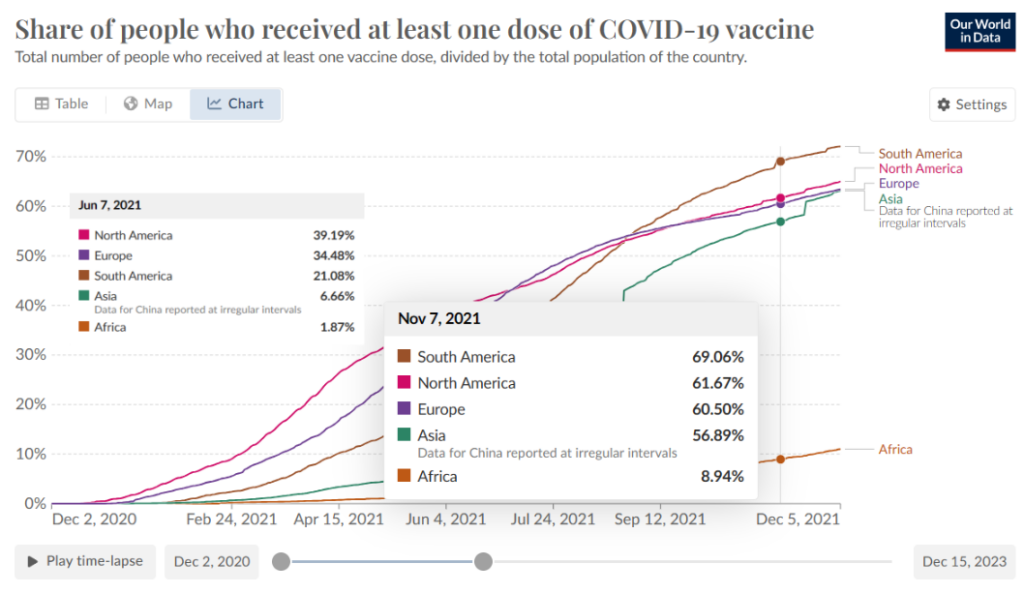
So, most of the unjabbed in 2021 were in Africa and, to a lesser extent, Asia. Did millions of these poor unvaxxed people die of Covid? Of course not.
Figure 4 shows Covid deaths across the world with Africa and Asia itemised. Where are all these deaths of the unvaccinated? Not in Africa, that’s for sure.
However, looking at Figure 4, we do see an inflection point. But it’s not when vaccines were introduced, or at any point in 2021, rather it’s when Omicron arrived in 2022.
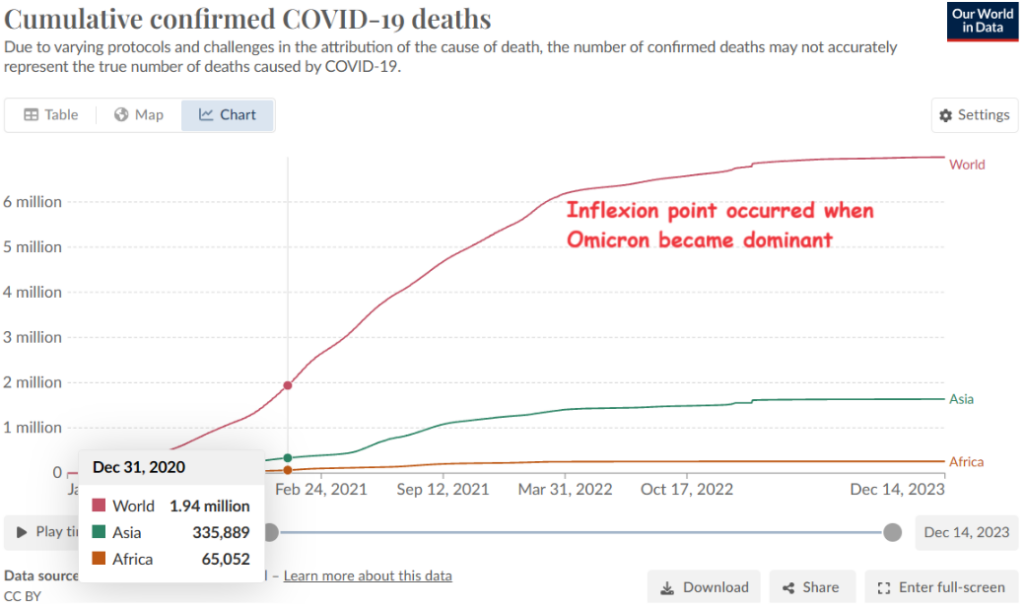
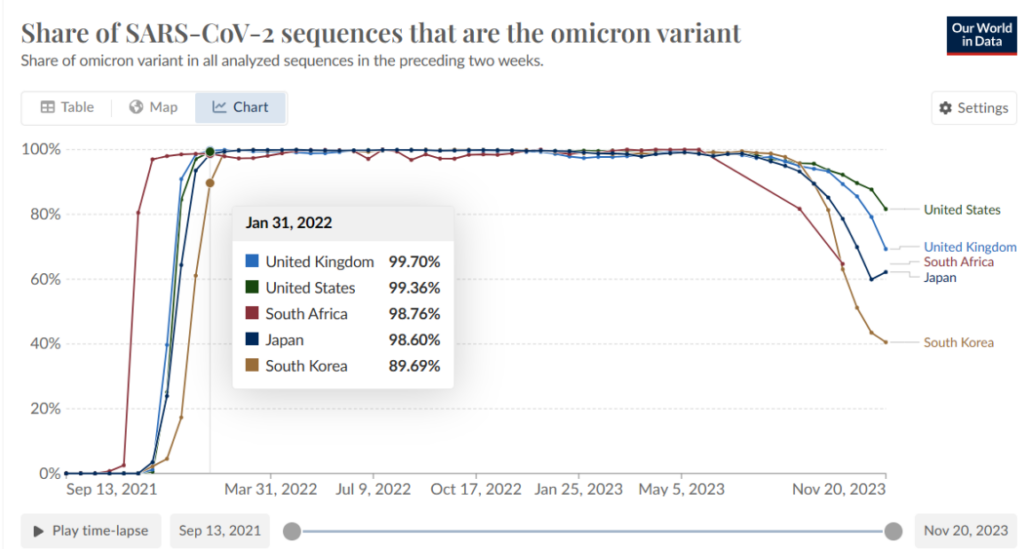
For good measure I’ve included a chart (see Figure 5) that shows the unbelievably rapid escalation of Omicron as the dominant, though milder variant, on all continents, at about the same time. Just in time to cause that March 2022 inflection point in consequent deaths.
It’s overwhelmingly likely that Covid was a man-made pathogen. It’s also been speculated that the Omicron variant, rather than having evolved naturally (albeit, from a man-made virus), was separately ‘manufactured’. If that’s the case, shouldn’t whoever developed Omicron be getting the plaudits rather than the developers of the uniquely useless vaccines, along with Mother Nature, for the perfectly adequate immunity system she endowed us all with?


To join in with the discussion please make a donation to The Daily Sceptic.
Profanity and abuse will be removed and may lead to a permanent ban.
Brilliant.
Another great big hole blown in the “vaccines saved gazillions of lives” nonsense.
How many?
Oh, so many we are still counting. We expect a final tally by about….err, 2030. Ish.
This bloody farce becomes more ridiculous by the day.
“Our World in Data reports that in 2021 about 3.5 million people globally died from Covid. ”
Does anyone think this figure has any useful meaning?
No, the real IFR was the same as the flu, meaning 99.7% had no risk of death.
In every country deaths from and only from Rona are 5-10% of the purported state total. Everyone else died from something else but given that Rona symptoms included evthg, the fake tests were given to everyone; and given that every death was paid for, the medical ‘profession’ made sure to inflate the death total.
“shouldn’t whoever developed Omicron be getting the plaudits”?
If the world found out that it was a US bioweapons lab who created Omicron AFTER they had made the original SARS-CoV-2 then it wouldn’t be plaudits they would be getting but a very long prison term.
It’s been out there for maybe a couple of years, mainly by drip feed.
Sadly it just shows how easy it is for people to be manipulated to somehow ignore it.
Just imagine if at the height of the “pandemic”, the BBC/MSM had proclaimed that it was ALL due to US bioweapon defence, lol, research and bigtec./pharma money, – how long do you think biolab scientists would have lived.
Yet they seem to be lauded as our saviours.
All hail our wonderful Genetic Engineers. Just a pity that they know only the square root of f.*** all about the immune system.
Interesting how little of a smoking gun there is for that. The usual suspects have continued to try and milk Omicron as a killer, as an indication for more boosters etc. In other words, Omicron is highly contra-narrative.
I suspect either Father Christmas working away in his own lab, or good old-fashioned Providence.
“I knew of two people personally who died of or with Covid. One was in his 90s, living with cancer and despairingly depressed from being locked in his room in a ‘care’ home. The other was over 70 and suffering from mesothelioma. ”
Assuming “covid” exists, those people may well have died “of or with” flu or a cold or some other respiratory virus in a season in which “covid” was not the dominant respiratory virus, or died of something else. That’s why “covid deaths” are a completely meaningless number. You need to look at all-cause mortality over a sensibly long period (given that it naturally fluctuates quite a lot) and probably not pay too much attention to “cause of death” for people late in life as it’s not all that useful. Once the all-cause mortality variation gets over a certain level it may be time for “public health” bodies to start getting concerned, and especially for younger age groups start looking at cause of death where it is more clear-cut. There was no significant variation in all cause mortality that would have warranted unusual action.
I only had a brief scan of this article, but Figure 1 with 10% excess mortality caught my attention. I cannot reconcile this with my excess weekly death presentations. These were zero from June 2020 to October 2020.
Since 2020, I have compared weekly deaths to the average of 2010-2019 corrected by population. Although this does not allow for population increase since 2020, I would have thought that the excess deaths in 2020 would not have been far off.
The small variations between June 2020 and October 2020 do not amount to any excess deaths. The hoax pandemic had disappeared. Excess deaths occurred after this. These correlate with increased midazolam prescriptions from October 2020 to December 2020 and with the toxic jab from January 2021 onwards.
At the moment, over the last year, we are seeing 10% excess deaths with a negligible number categorised as ‘covid’ deaths. But I do not see 10% or more excess across the whole period as Figure 1 shows.
Can anyone shed some light on this?
I agree with you. At the time, I plotted England and Wales all-cause mortality for 2010 up to cw47 of 2021, and these data show roughly normal levels of mortality between cw24 and cw41 (i.e. early June to early October) of 2020. I just checked the actual data and the number of deaths in this time range are all less than 10% above the mean value of deaths in the corresponding weeks of 2010 to 2019, whereby I did not correlate anything with population values, so my data exclude the increase in population and would therefore be higher than the true case.
My data are only for England and Wales. When I did look at Northern Ireland and Scotland data at the time, they seemed just to mirror the E&W data, so I was always too lazy to make a UK data set!
The article shows that their UK data were taken from the “Human Mortality Database (2022), World Mortality Dataset (2022)”. I only ever used original government data (in this case, ONS) and never processed data from who knows where.
To summarize, I agree there was no 10% increase in UK deaths in the period June to October of 2020. I append the graphs I created at the time.
“It’s overwhelmingly likely that Covid was a man-made pathogen”. No doubt you mean Covid-19, not all the other Covids that are common, being branches of common colds. Depending on the sources, 229E, NL63, OC43, or HKU1 – all coronaviruses – tot up to about 30% of the total number of “common colds” caused by coronaviruses, with the rest being to do with rhinoviruses. Some might say that I’m being pedantic, but deliberately renaming things to make them look worse has been part of the problem. Alright, sometimes it’s normal to short cut things, but I think many of the intelligent actors involved do try to promote their position by inducing fear in the general public that way. Occasionally being selective with the truth is a useful back door way of promoting a position. In this case, promoting the belief that Covid is a new threat.
I mostly stopped reading when I saw the mention of Imperial College. Damaged goods now
I had one relative who definitely died of Covid; a cousin, male, aged 58 and overweight. He was a professional photographer who would have spent a lot of time in a dark room, so perhaps his Vit D levels were low. His wife and daughter got Covid at the same time and both recovered.
I don’t know or know of anyone else who died with or of it.
And I know five people who, post jabs, have had strokes (three are now dead); two men who have had serious heart attacks; and four people who developed aggressive cancers – two dead, one terminal and one who is being treated and may survive.
We know that the Absolute Risk Reduction of the jabs was around 1% – that’s what Pharma’s research showed – but they manipulated the propaganda by publicising the Relative Risk Reduction figure of around 95.%.
If the Absolute (ie real) risk reduction is 1%, Imperial College’s figures are obviously bollocks….which is what they seem to specialise in producing.
The anti COVID vaccination agenda (ranging from they were simply useless through to deliberately mass murderous) is as unreliable and based on flawed data as the ‘Covid 19 was a devastatingly fatal new illness requiring unprecedented NPIs such as lockdowns’ one.
They are two sides of the same propagandist / ascientific coin.
In this article’s attempt to prove their complete ineffectiveness it makes use of relatively irrelevant graphs showing worldwide / Asian / African inflection rates in early 2022 correlating to the speedy onset of the Omicron variant.
However a much more relevant pictorial representation of the [at least potential] effectiveness of the vaccination programme would be this one of death rates from COVID in the UK April 2020 – August 2022
https://www.google.co.uk/search?client=ms-opera-mobile&sca_esv=593038284&channel=new&espv=1&q=uk+covid+deaths+2019+-+2023&tbm=isch&source=lnms&sa=X&ved=2ahUKEwjWzLXq1qKDAxUbaUEAHcZRBI4Q0pQJegQIBxAB&biw=412&bih=677&dpr=1.75#imgrc=ZCBMaZbpCve1VM
The progressive roll out of jabs in the UK began Dec 2020 and by March 2021 all over 65s plus those with background endangering medical conditions who wanted one had been vaccinated.
https://en.m.wikipedia.org/wiki/COVID-19_vaccination_in_the_United_Kingdom.
Scroll down halfway for roll out chart.
Of course correlation does not prove causation, but at the very least the UK coronavirus morbidity graph above shows that the sudden dramatic decline in spring 2021 obviously had nothing to do with the onset of Omicron the following year, the principle alleviating factor pointed to in this article.
A questioning or sceptical approach to health related and other practical hypotheses (such as the one presented above) should not be suspended due to political and ideological biases.