
My colleague, the brilliant Professor Christof Kuhbandner, sent me an e-mail about an update to his pre-print analysing excess deaths and stillbirths in Germany from 2020 to 2022, co-authored with Professor Matthias Reitzner. This is the most thoughtful and carefully done analysis of excess deaths during the pandemic that I’ve seen. With his permission, I reprint his e-mail summary below and embed the full document at the bottom.
First of all, it is interesting to look at the excess mortality per year depending on the age group; here is the corresponding result figure:
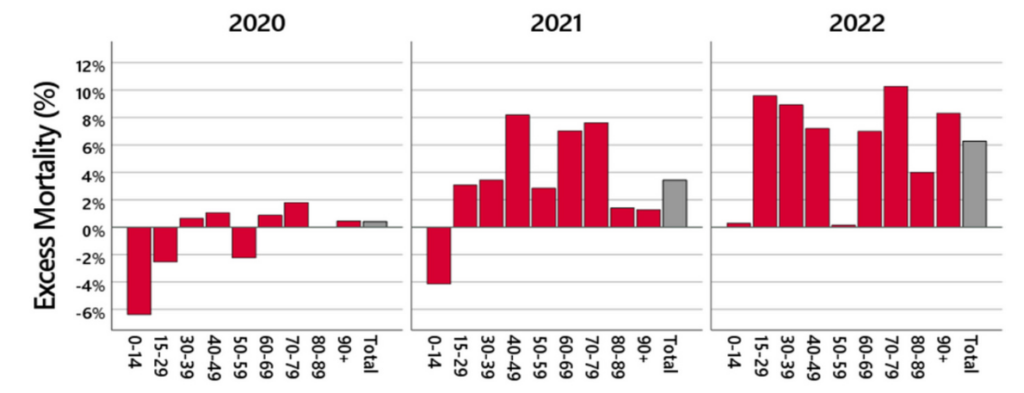
It had already become apparent for 2021 that an excess mortality is observed particularly in the middle age groups. This trend has continued in 2022: now a high excess mortality is already being observed in the 15-29 age groups. There – on average across all months in 2022 – almost 10% more deaths than expected occurred.
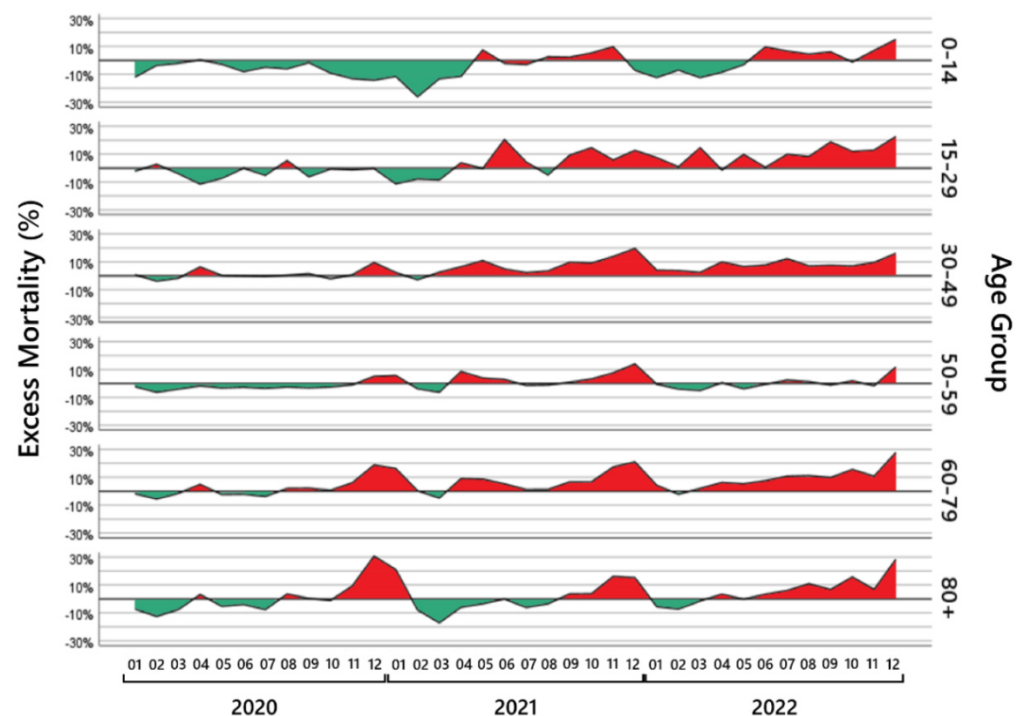
The next thing that is striking is the course of excess mortality within the years depending on the age group. Here is the corresponding result figure (red areas are excess mortality, green areas are mortality deficit):
There are several notable observations here.
It is initially interesting to look at the excess mortality from November 2020 to March 2021, when there was a strong Covid wave at the turn of the year. On the one hand, there is a strong age dependency: the older the people, the higher the excess mortality, and there is absolutely nothing to be seen in the age groups under 30. On the other hand, you can see a typical pull-forward effect: the phase of excess mortality is followed by a phase of a mortality deficit in all affected age groups, i.e., the Covid wave hit many people who would have died within the next few moths anyway. In other words, the excess mortality phase is balanced out by a subsequent phase of a mortality deficit, meaning that cumulatively there is hardly any excess mortality at the start of the vaccination campaign at the end of March 2021.
This pattern changes from April 2021 onwards – the start of the vaccination campaign. Suddenly, an excess mortality appears that is no longer dependent on age, and which is no longer compensated for by subsequent phases of a mortality deficit. This is particularly evident in the younger age groups. Up to the time of the vaccination campaign, for example, there was no excess mortality in the 15-29 age group. But since vaccination started in this age group, suddenly more 15-29 year olds are dying than expected. There are hardly any phases of a mortality deficit anymore, and excess mortality is rising and rising. In December 2022, 22.5% more people died in this age group than expected – an age group in which nobody normally dies so easily. A similar pattern is found in the 30-49 age group and the 60-79 age group. And even in the 80-plus age group, where initially phases of excess mortality were always offset by subsequent phases of a mortality deficit, this changed in 2022. There, too, a worrying steady increase until the end of December 2022 is observed.
The course of stillbirths is also striking. We have analysed stillbirths based on the data we received from the Federal Statistical Office of Germany. Here is the corresponding results figure:
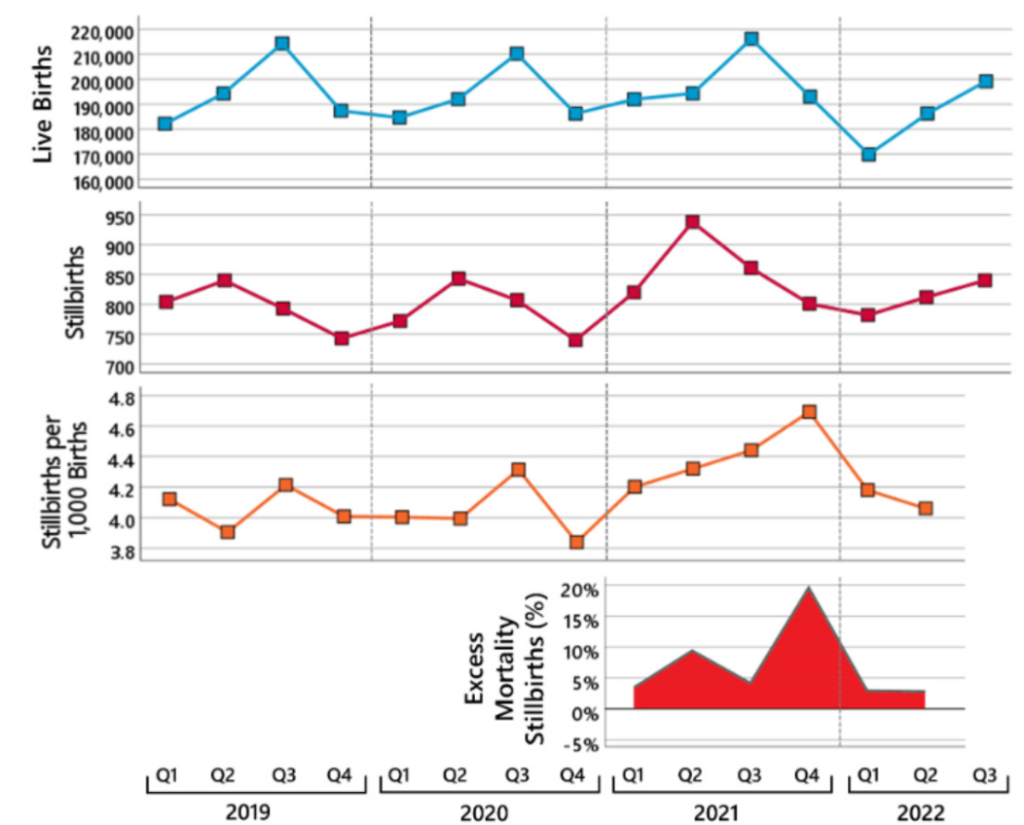
The upper panel shows the course of live births and the panel below the course of stillbirths since 2019 (the diagnosis of stillbirths was changed in Germany at the end of 2018 so that the numbers before 2019 are not comparable).
The already-known massive decrease in the number of live births in the first quarter of 2022 – exactly nine months after the start of the vaccination campaign – can be seen impressively. The data on live births are now available from the Federal Statistical Office up to the end of October 2022, and contrary to what one might have hoped, this is not just a short-term decrease in the number of births. In the third quarter of 2022, 14 500 fewer children were born alive than on average in the previous years 2019-2021.
A different picture emerges for stillbirths. Until the end of the first quarter of 2021, the trend since 2019 has been very stable, similar to that of live births. A sudden increase is then observed in the second quarter of 2021, and the number of stillbirths is also higher in the third and fourth quarters than in previous years. That is, before the number of live births decreases at the beginning of 2022, the number of stillbirths increases in the previous quarters.
Since the number of stillbirths depends on the number of pregnancies, to assess the increase of stillbirths one has to relate the number of stillbirths to the number of live births. It is important to note that in women who became pregnant at the same time, stillbirths occur about a quarter earlier than live births. This can be seen in the figure above, where the seasonal peaks in stillbirths occur a quarter earlier than in live births. In order to estimate the proportion of pregnant women who have lost their child, the stillbirths in one quarter must be related to the number of live births in the following quarter. The third panel in the graph above shows the estimated proportion of pregnant women who lost their child (number of stillbirths per 1,000 total births).
As can be seen, there is no major change until the first quarter of 2021, apart from the usual seasonal variation. In the second quarter of 2021, the proportion of stillbirths suddenly increased by 9.4% compared to the average of the two previous years; in the fourth quarter of 2021 the proportion of stillbirths is 19.6% higher than in the previous two years. This is illustrated in the bottom panel of the figure above.
In summary, the following picture emerges: From the beginning of April 2021 onwards – the start of the vaccination campaign – excess mortality suddenly increases continuously up to the youngest age groups and is no longer compensated by phases of a mortality deficit. That is, unlike before, the observed excess mortality no longer represents a pull-forward effect where the highly vulnerable people die some months earlier than expected. In addition, the number of stillbirths is increasing at the same time. Nine months later, a massive and sustained decrease in live births is observed.
As an analysis of the course of excess mortality and Covid deaths shows, this cannot be explained by Covid deaths. Here is the corresponding results figure:
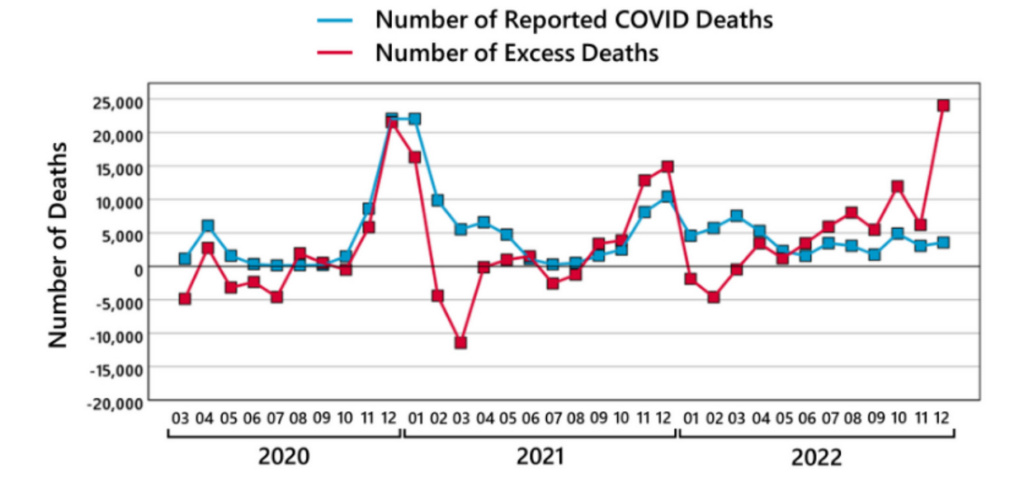
From February 2021 onwards, the excess mortality curve decouples from the Covid deaths curve. Despite a phase of a significant mortality deficit, a high number of so-called ‘Covid deaths’ are still being reported, which raises great doubts about the validity of the ‘Covid death’ diagnosis. Apparently, this diagnosis was often used for deaths that would have died at the same time regardless of Covid. From September 2021 onwards, excess mortality starts to be higher than the number of Covid deaths, and in 2022 excess mortality went through the roof while the number of Covid deaths progressively decreased.
The parallel between the excess mortality curve and the vaccination curve is striking. Here is the corresponding results figure:
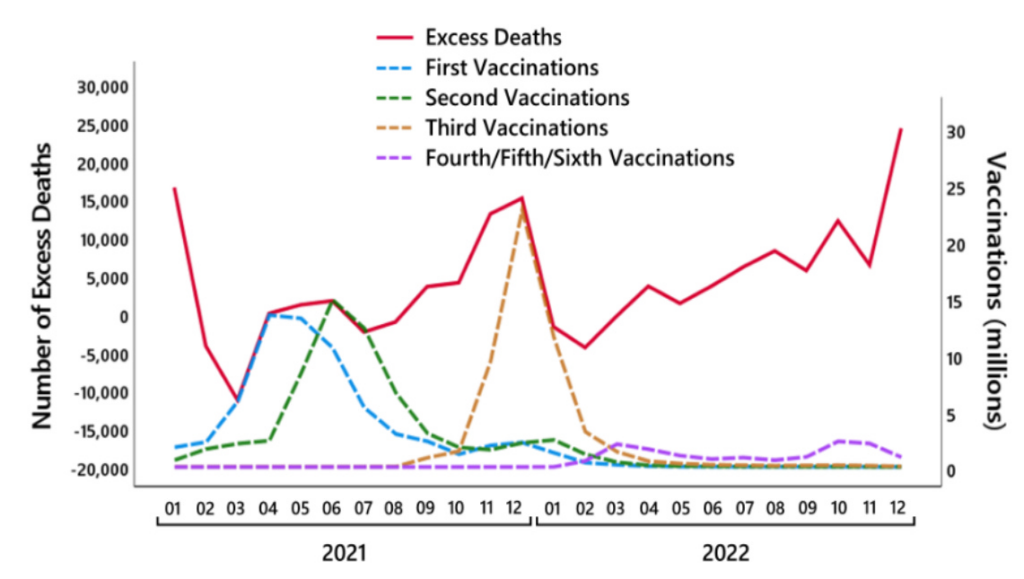
Excess mortality is increasing in parallel with the increase in the number of first vaccinations. Exactly as the number of first vaccinations decreases, excess mortality also begins to decrease, but not as much as the first vaccinations, perhaps because the number of second vaccinations increases at the same time. And exactly with the peak of the second vaccinations, excess mortality also reaches its peak, only to then decrease exactly parallel to the second vaccinations. With the start of the third vaccinations, there is a parallel increase in excess mortality, and exactly as the third vaccinations decrease, the excess mortality also decreases.
Of course, correlation does not have to mean causation. But exactly such a pattern would be expected if vaccination as an adverse side-effect increases the number of unexpected deaths. And meanwhile, it can also be regarded as clearly documented that the vaccinations definitely lead to unexpected deaths. In particular, the existing findings suggest – but unfortunately there are still no epidemiologically valid data on this – that the number of unexpected vaccination-related deaths is definitely high. In our paper, we refer to the peer-reviewed findings of the renowned Heidelberg pathologist Peter Schirmacher. Here is the summary from our paper:
For instance, in a study of a research team led by Peter Schirmacher, out of 35 bodies found unexpectedly dead at home with unclear causes of deaths within 20 days following Covid-vaccination, autopsies revealed causes of death due to pre-existing illnesses in only 10 cases. From the remaining 25 cases, in three cases it was concluded from the autopsies that vaccination-induced myocarditis was the likely cause of death, and in two cases it was concluded that this was possibly the case. According to Supplementary Table 1, vaccination was the cause of deaths in further cases as well. For instance, a 38-year-old man with no relevant preexisting disease died due to vaccine-induced thrombotic thrombocytopenia; a 23-year- old woman with no relevant preexisting disease died due to pulmonary embolism, which may also suggest vaccination as the cause of death.
These findings indicate two important aspects. First, the findings show that Covid vaccinations can cause deaths as a side-effect. Second, the findings show that deadly side-effects of Covid vaccinations are not extreme exceptional cases. The authors of the paper correctly conclude that epidemiological conclusions in terms of incidence or risk estimation cannot be validly drawn from their study. However, the fact that the re-examination of only 35 deaths of only one specific type (bodies found unexpectedly dead at home) in only a small region in Germany (catchment area of the Heidelberg University Hospital) already reveals so many deaths that have likely or probably been caused by a Covid vaccination at least suggests that Covid vaccine-induced deaths are not extremely unlikely.
Here is the full paper, which can also be accessed on ResearchGate.
Dr. Josh Guetzkow is Senior Lecturer in Criminology and Sociology at the Hebrew University of Jerusalem. This article first appeared on his Substack page Jackanapes Junction, which you can subscribe to here. Dr. Christof Kuhbandner is Professor of Psychology at the University of Regensburg. Dr. Matthias Reitzner is a Professor in the Institute for Mathematics at Osnabrück University.


To join in with the discussion please make a donation to The Daily Sceptic.
Profanity and abuse will be removed and may lead to a permanent ban.