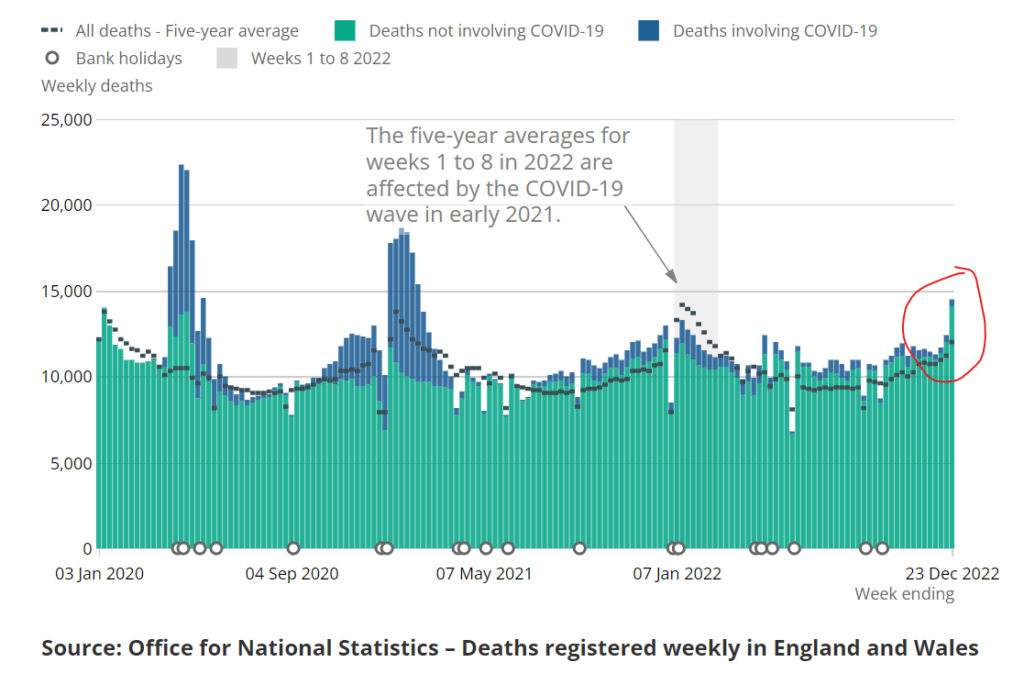
Deaths registered in England and Wales were a massive 20.7% above the five-year average in the week ending December 23rd, according to the latest data from the ONS. There were a total of 14,530 deaths that week, which is 2,493 above the five-year average. Of these, 429 involved COVID-19 as a contributory cause and 308 were due to Covid as underlying cause, leaving 2,185 excess non-Covid deaths. Of the total, 829 deaths were recorded as due to ‘influenza and pneumonia’ as underlying cause. The total number of excess non-Covid deaths since the surge began in April is now just shy of 30,000 at 29,880.

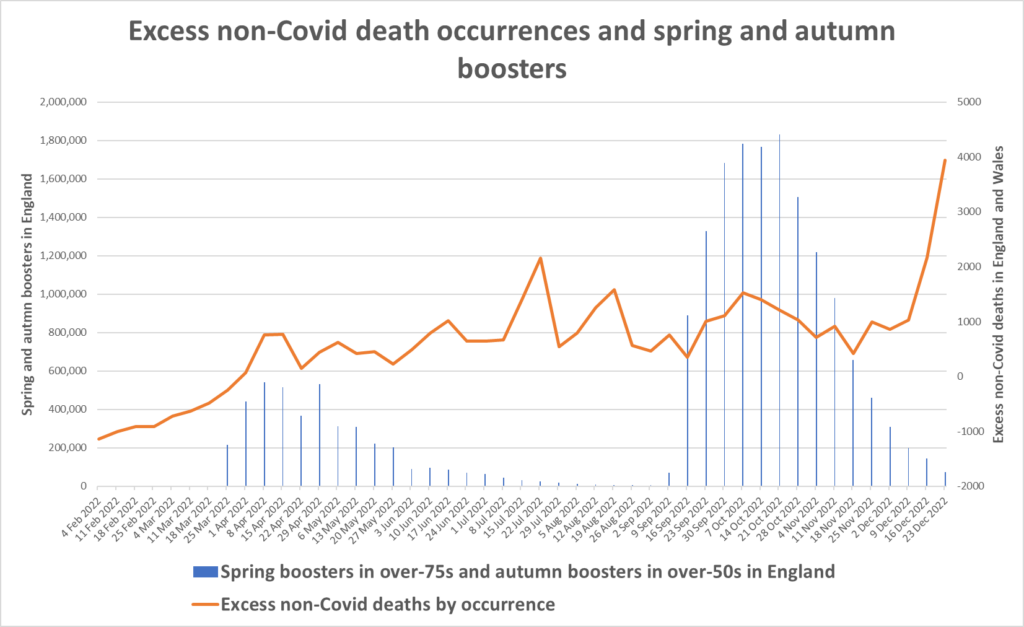
The chart below plots the deaths by date of occurrence. I have also plotted the vaccine boosters, though clearly the latest surge in excess deaths (unlike those in the spring and autumn) has no correlation with new booster doses.

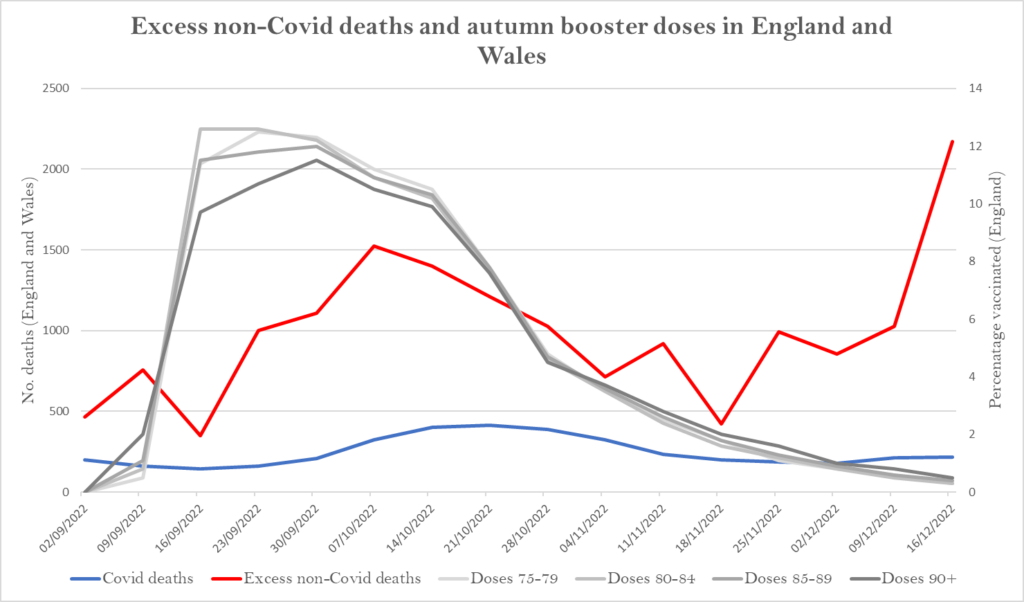
This chart shows autumn booster doses in over-75s along with excess non-Covid deaths, showing the correlation during the autumn, though not in December. Covid deaths are also shown.

The cause of the huge number of excess deaths in December is unclear. Detailed cause of death data are not yet available for December. The excess deaths are concentrated in the older age groups, with no notable rise in the under-50s, who were notably excluded from the autumn booster campaign. It is a severe flu season, so this will be contributing. The pressures on hospitals, ambulances and other health services will also be playing a part. Once again, the rise in excess non-Covid deaths has occurred at the same time as a wave of Covid infections. This phenomenon has been observed internationally and the reasons for it are unclear. An interaction between the Covid vaccines and Covid infection, perhaps resulting in deadly autoimmune attack on vital organs such as the heart, or via some other mechanism, remains possible and requires further investigation.
Are excess deaths higher in the vaccinated? The U.K. Government, like other governments, does not publish good quality data on deaths by vaccination status (which seems suspicious in itself). However, deaths during 2022 are notable for reversing the usual demographic trends, with less deprived groups and white people having higher excess death rates, as shown in the charts below, which were produced by HART. Note how the red line moves from being at the bottom in 2021 to at or near the top in 2022.


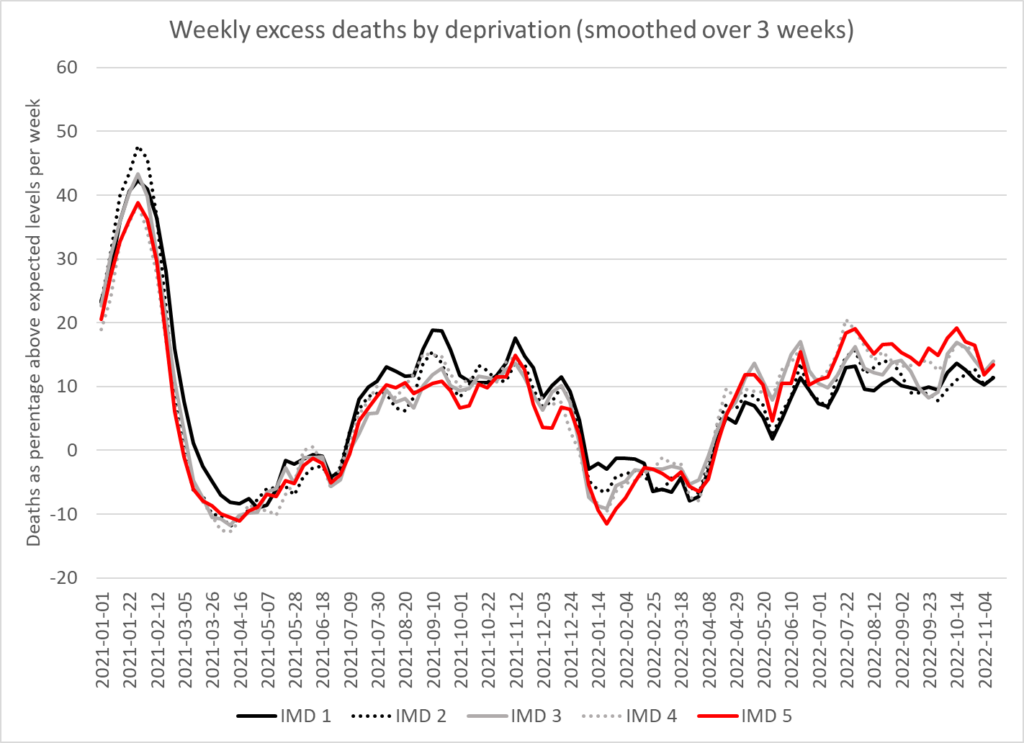
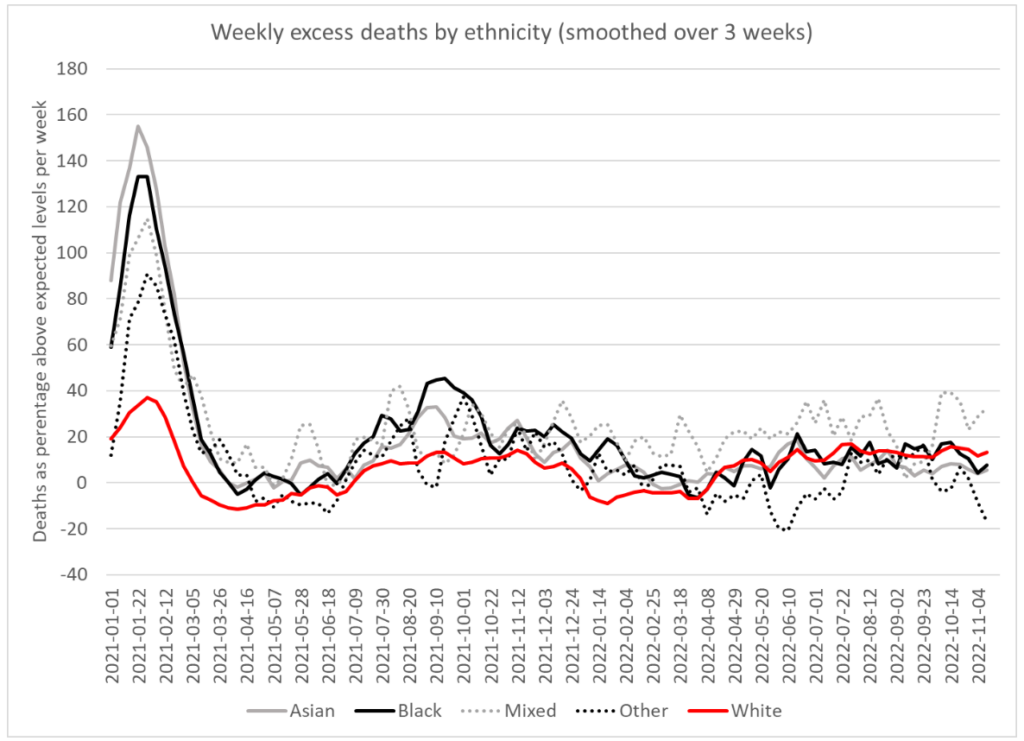
The most notable difference between these demographic groups that could explain such a remarkable shift is that whites and less deprived groups tend to have higher vaccination rates. For example, despite being more diverse and lower income, London had much lower excess deaths than the South East during 2022. Between May 1st and November 18th, London had excess mortality of 8% versus 13% in the South East. London is double-jabbed 80% and triple-jabbed 64%, well below the rates in the South East, which is double-jabbed 90% and triple-jabbed 80%. This is hardly conclusive proof, but alongside other data is highly suggestive that vaccines are playing a role in the recent high excess mortality.
To join in with the discussion please make a donation to The Daily Sceptic.
Profanity and abuse will be removed and may lead to a permanent ban.
On the topic of pro athletes and cardiac arrests; if Dr McCullough says it then it must be true. A shocking statistic and totally damning for the clot shots roll-out;
“Before COVID-19 vaccines, the average number of cardiac arrests in all of the European soccer football leagues, which is way more players than the NFL, the average number of cardiac arrests was 29 per year. That’s before the vaccines. The vaccines are ushered in in 2021, and since that time, the tally now for cardiac arrests on the field with professional sports players in Europe — 1,598! 1,101 of them have been fatal cases. Two-thirds cannot be resuscitated. So Damar Hamlin was very fortunate he was in the third that was successfully resuscitated and survived thus far.”
https://vigilantfox.substack.com/p/dr-peter-mccullough-provides-in-depth
I wonder how many pro athletes, musicians and celebs are bricking themselves right now?
Aaron Rodgers is probably having a hard time not saying, I told you so.”
Could an analysis of worldwide sports statistics and lower performance also point to vax damage? An acquaintance advised her teen daughter not to get the jab, but the girl got it anyway once she turned 18. The girl–once a top high school soccer player–is now complaining that she can’t run down the balls like she used to and is having trouble catching her breath.
Unfortunately I think many idealistic and naive young people still see getting jabbed as a “political” act, indicating what a nice, caring, selfless, progressive team-player they are, and distancing themselves from being individualistic, selfish, and conservative (although of course I would not characterise common sense, tough love, or small-c conservatism as being selfish in the slightest, quite the opposite.)
That was the intention of the behavioural scientists on SPI-B make poisoning yourself a virtuous act and as a tactic it worked well. It’s reprehensible and deeply unethical, but it worked.
Indeed. My mask protects you, and your mask protects me.
That so many people couldn’t see through such obvious psychological manipulation was and is both revealing and depressing.
Must be climate change, lol. Move along, nothing to see here folks….
Thanks for this M. I wonder what auntie Beeb would have to say about this story….
Given the shocking state of the NHS at the present (thanks very much lockdown zealots) it must be difficult to say how many people are dying unnecessarily due to lack of care from the health system. For sure, waiting hours on the floor with a broken hip for an ambulance, or gasping for 12 hours in A&E with a chest infection will not be helping the elderly.
One would reasonably think deaths should be down due to the dry timber effect of the last two winters – and of course the success of the world class/mass “vaccination” roll out.
But no, we appear to have an excess of excess deaths.
Will there be any investigation charged with seeing whether there is a causal link?
Not in Clown World there won’t.
Any such announcement would destroy the public’s faith in the miracle of mass vaccination you see – and that would never do because vaccines have save countless millions of lives – FACT. Bigpharma have been aware of this for decades and that is precisely why no mass studies of the health outcomes of the vaxxed v. unvaxxed have ever been released.
But, maybe the dam is beginning to crack insofar as mRNA jabs are concerned, beginning in Japan from what I read.
I don’t think the MSM can continue to ignore the biggest Medical Elephant in the Room much longer. The dimmest of sheep are beginning to wake up (and even the Guardian might be having a rethink). Lol.
Perhaps even the useless opposition parties in Parliament?
Erm, no.
We are a one party state sub division of WEF central.
The Groan?
I don’t believe it.
The US is also seeing excess deaths. I asked my actuary niece for an explanation. She said overdoses, which, while too high, are not even in the top three causes of death. OK….
Actually, there has been one study comparing jabbed/unjabbed kids, by paediatrician Dr Paul Thomas in 2020 based on 10 years of data. Unsurprisingly, he was immediately suspended without due process, paper retracted, all the usual. It has subsequently been reviewed by Drs Lyons-Weiler and Blaylock and the data found to be robust (jabbed kids are sicker than unjabbed kids). Who knew? But you won’t read about that in the Graun.
https://popularrationalism.substack.com/p/new-study-from-ipak-results-shows
No surprise.
20.000 dead post Stab 1.
20.000 or so dead post Stab 2.
30.000 post stabbinations 3, 4, 5…..
Hey I see a trend. I am not ‘the science’ and just an anti-ist but I see a pattern….I wonder what it all might mean…..
It’s obvious. Anti-vaxxers spread scare stories each time a booster comes out, and that’s what’s scared people to death. And the lack of correlation this time is because it’s all the strikers’ fault.
Ha ha. Or it is the climate thingy and bacon. We can correlate all the dead post stabs with a weather event and spiking sales of bacon at Sainsbury….not to mention the Euro-Pound exchange rate correlated fluctuations.
… the latest surge in excess deaths (unlike those in the spring and autumn) has no correlation with new booster doses.
The terrifying thing is that this may not be entirely correct – in that the deaths may be occurring weeks and months after the stabs, thereby leaving no obvious graph-on-graph correlation.
But if the stabs are causing what might be called time-bomb-damage – that is damage that manifests itself at random times a long while after the actual stabs – then all we’ll see, over time, is more stabs = more deaths. An example might be asymptomatic cardiac damage in the wake of the stab, leading to a greatly increased heart attack risk at some indeterminate time in the future. Presumably the same might be said for prion diseases or cancers.
I’m not stabbed, but I shudder to think what might be going on. It really is terrifying.
One thing’s sure though: the sooner what is going on is understood then the sooner mitigating actions might be taken. But the health authorities are failing even in this. There really isn’t much good that can be said about anything going on right now.
“The terrifying thing is that this may not be entirely correct – in that the deaths may be occurring weeks and months after the stabs,”
No question that “future” deaths were definitely part of the recipe for the death shots. It had to be in order to produce the “plausible deniability” excuse. Which of course is how we got to ‘SADS’. How very convenient.
Well done H, you attracted 3 down votes at time of reading.
Probably not a popular take but, I really don’t care about “excess deaths”.
Before covid insanity I hadn’t even heard of the term. I lived half a lifetime blissfully unaware of national mortality levels. I just focused on taking care of myself and my loved ones and assumed others would do the same.
Furthermore, I don’t care what it says about the proper functioning of the NHS. I don’t need that stat to assess the NHS’s service. My experience of the service tells me everything I need to know. Can I see a doctor when I need to? Do I get proper treatment when he does? That’s more than enough information.
If I don’t hear about excess deaths again, regardless of whether the number is high or low, I’ll be very happy.
I agree with you up to a point. However:
1) If it’s the vaxx, then we need to know otherwise “informed consent” is impossible
2) Our tax money is being spent on the vaxx. If it’s killing people rather than helping them, I’d rather it got spent on something else.
However in the scheme of things it’s arguably just one piece of a larger piece of folly and evil which is our enormous, useless, harmful, lying state/government.
“If it’s killing people rather than helping them, I’d rather it got spent on something else:”
Indeed, like prosecuting to the max all those guilty of pushing the shots on the public and ensuring they are never in a position to repeat their genocidal activities.
Ever
AGAIN.
The excess deaths statistics doesn’t tell you whether people are dying from a jab or otherwise.
All it is is a number that says, oooh look more people have died this month than we expected would.
Then those who think that jabs are killing people can speculate its the jabs. Others will say it’s a consequence of the lockdowns, others will say its.global warming, covid freaks will claim its the long term consequences of covid.
And the stat will leave everyone none the wiser.
It’s useless. Completely useless.
It’s not completely useless, some of those explanations you mentioned are more plausible than others, and may become more plausible as more information emerges over time. Getting to the truth isn’t necessarily easy but that doesn’t mean it’s useless to try to get to the truth, and we need to keep an open mind.
For a start it’s useful in that it tells us something slightly unusual is happening which gives us the chance to try to find out what that might be. This may or may not be possible, but if it’s due to a factor or combination of factors that we can influence in some way then surely we should do so.
Of course I don’t KNOW what the reasons are but there are some evidence based indications that the jabs could be involved and as a minimum that tells me that this is something that should be looked into.
Me too. Excess deaths is also an ill-defined measure.
It’s assumed that something like number of people dying in December exists as real-world quantity and that the number of people dying in any particular December is an approximate measurement of the real NOPDID containing a certain amount of error. To reduce random error, the actual values are then averaged. This obviously makes perfect sense. Not. While it’s a safe assumption that the immediate future will be pretty similar to the immediate past in many respects that’s an heuristic based on experience and no hard-and-fast truth. There is no such thing as the correct NOPDID. A different number of people while die in every new December.
And then, obviously, while this heuristic may be useful to spot something extraordinary going on, the difference for each new December would still need to be outside of the expected variance. As there’s again no standard deviation for the average, that’s impossible to tell.
Yes. All that, and also it says nothing at all about the causes of deaths, leaving it wide open for everyone to speculate and push their pet idea.
In fact if accurate and reliable records were kept of every death, then you’re much better off seeing where there are spikes in particular causes of deaths. Basically what they did with covid but honestly and reliably and for each cause.
Indeed – so you use the general statistic to tell you that there is a need for closer examination
That metric “deaths involving COVID” should really read “deaths fraudulently recorded as involving COVID”.
There has been a surge in deaths in the past two weeks (the ONS didn’t have a weekly report last week so this is two weeks of data) and that’s a surge above the 10% or so excess deaths that had already been happening up to then.
Hard to say what what is going on but of course the experimental vaccines seem to be implicated.
There has indeed been a big rise in deaths in the oldest age groups for example see the attached chart for the 85 and above age group in relation to registered deaths. And yet deaths in the 15-44 age group are sharply down in the latest week, week 51, although they were high in week 50.
For all its major faults we do need another ONS deaths by vaccination report to see trends, the last one covered deaths up to 31st May 2022. All we know is an ONS note from 31st October saying
There will be a delay in publishing the next edition of the deaths by vaccination status dataset as we require data on subsequent booster vaccinations and will be updating to the 2021 Census populations. The next publication date will be announced on the release calendar when this is confirmed.
The ambulance delays may have significantly caused cardiac deaths (as happened to Aseem Malhotra’s father albeit that was a while back). Perhaps younger heart attack casualties have been prioritised and older people left to effectively die explaining the age disparity in deaths.
The experimental vaccines have caused heart damage and the cold weather in the middle of December (heart attacks occur more often in cold weather) was perhaps then the tipping point for many that then caused deaths from heart attacks which were then reported as deaths in the two weeks up to 23rd December (?).
And in terms of deaths by occurrence data there are potential errors in relation to estimates of deaths that have occurred but not been reported. So later weeks data, when most deaths have then been reported, will show up any errors.
But in relation to the past few weeks the precise cause is all speculation at the moment as far as I am concerned.
And the age 15-44 chart showing the fall in registered deaths from week 50 to week 51 (contrasting with the big increase for the 85+ age group).
I have a suspicion that they delayed reporting some deaths from the previous week, so that they could blame the striking healthcare workers.
I very much doubt that there were more than a handful of excess deaths due to the strikes — the excess deaths remain baffling.
If there was no delay in reporting then the spike in deaths for w/e 23rd is very concerning. Things should become more clear over the coming weeks.
I see that certain NHS bosses are saying that the NHS waiting times “Could cause an extra 500 deaths per week”.
Phew. Thank God for that intelligent insight.
(I almost thought the Vax may be to blame).
There are excess deaths reported on EuroMOMO particularly for France and Germany. Do they have strikes as well?
Our strikes are causing their deaths – a bit like our lockdown restrictions caused a drop in Sweden’s “covid cases”.
The deaths by week of occurrence date (when roughly finalised in perhaps 3 weeks time or so) should tell us whether there was an increase in all cause deaths specifically for the week ending 23rd December (the ambulance strike was 21st December). Even if there was it doesn’t mean the ambulance strike was the cause, but some may try and blame it on that.
Thanks for demonstrating with an example how completely useless excess deaths figures are.
Apart from the fact that they may be susceptible to being fiddled, they say nothing about the cause of death and only provide fodder to push our personal theories and agendas.
The burden of proof is on the bioweapon manufacturers & governments peddling these toxins to prove that the excess deaths are not due to the toxic injection. We do not have to prove that they are behind the increase. Our role is to ask questions, demand the hard evidence, not stupid modelling, & plant the seed that this increase is down to something that was first unleashed onto the world via injection from December 2020 onwards.
My comparisons are always with age-corrected data for 2010-2019, which is completely outside the hoax pandemic.
On this basis, the last week was 34.6% above average. However, I also prefer working to a 3-week average, and even this is 17.4% above average (and 5.1% above maximum).
My analysis shows the accumulated excess deaths from 1st April (spring booster) to be 44,358, or 11.6% above average.
I split the deaths into age groups and this shows some interesting facts. Percentages for low-mortality age groups may be deceptive, but here are a few.
A 42% increase (9 to 13) in deaths for ages 1-4? Did the mothers get jabbed in 2021?
A 94% increase (6 to 12) in deaths for ages 10-14? This may be delayed reporting of the MHRA figure of 9 vax-related deaths in under 18s announced a few weeks ago.
The above figures are, of course, for one week. But the 3-week average is still 39% for ages 1-4 and 26% for ages 10-14.
Age group 5-9 seem to have escaped the jab adverse reactions. They are too old to be born of jabbed parents and too young to have been jabbed. Of course, this may be just speculation. What else can one do if not enough data is provided?
I keep track of the figures on Telegram here.
Good work, thanks Mike.
You can see on my chart also for the age 5-9 age group that mortality in 2022 has been close to the 2015-2019 5 year average, just slightly above. And at the end of 2022, 11% of the 5-11 year age group had been experimentally vaccinated according to UKHSA. At the beginning of 2022 it was 0% of 5-11 year olds experimentally vaccinated. Don’t think there is vaccination data for the 5-9 age group alone hence I’m quoting the 5-11 figures.
The normal mortality in 2020 and 2021 for this age group is consistent with covid not affecting this age group at all in terms of any mortality signal and with an almost zero number of them having been vaccinated up to the end of 2021.
For the 10-14 age group age mortality in 2022 has been quite a bit higher than the 2015-2019 5 year average. And at the end of 2022, 49% of 12-15 year olds had been experimentally vaccinated according to UKHSA. At the beginning of 2022 it was 36% of 12-15 year olds experimentally vaccinated. Again don’t think there is vaccination data for 10-14 age group alone. But the higher mortality in 2022 throughout the year in this age group at first glance associates with a significant level of vaccination in this age group throughout the year.
The normal mortality in 2020 for the 10-14 age group is consistent with covid not affecting this age group at all in terms of any mortality signal and with essentially none of them having been vaccinated up to the end of 2020 of course.
The below average mortality in the first part of 2021 for the 10-14 age group is consistent with covid not affecting this age group at all in terms of any mortality signal and with few of them having been vaccinated. But there is an increase in mortality at the end of 2021 taking it back up the 2015-2019 year average which may associate with vaccination rates going up in this 10-14 age group.
There was an increase in mortality that occurred in the 15-19 age group after experimental vaccination began (having been around or below the 5 year average before then). This has been widely discussed before e.g. by HART.
Again this is consistent with covid not affecting the 15-19 age group at all in terms of a mortality signal in 2020 or the first part of 2021, but the increase in mortality after vaccination starts during 2021 seems to associate with the experimental vaccinations.
Good analysis. Thanks Mike.
The lack of 5 year banded data prior to 2020 has always been a problem. Can I ask where you get your 2010 to 2019 weekly (or 3 weekly) average figures from?
I’m using this by the way for the 5 year average
https://www.ons.gov.uk/peoplepopulationandcommunity/birthsdeathsandmarriages/deaths/adhocs/11485fiveyearaverageweeklydeathsbysexandagegroupenglandandwalesdeathsoccurringbetween2015and2019
Thanks for you analysis, Freecumbria. I have a brief explanation of what I do on my Telegram account here. I will cut and paste.
1. ONS weekly deaths data from 2010-2019 is factored up to 2019 population levels using data here.
2. Deaths are proportioned from wider age-bands to match the current 5-year age bands.
3. Deaths are then distributed daily. Average, minimum and maximum daily deaths are found.
4. Weekly deaths are then summed to match the exact day/month as 2022.
This method gives a reasonable average to compare with. The minimums are a little smaller and the maximums are a little bigger. Not many people do it this way, so my numbers work out a little different.
In particular, ONS use a 5-year average that may be compromised by the so-called ‘pandemic’. My method is to compare with a larger number of “normal’ years that are not compromised by the so-called ‘pandemic’.
Thanks Mike
I have a suggestion. Please tell me if I am being silly. The covid virus is similar to that of colds and flu. The vaccines have suppressed the immune system. I imagine they have particularly weakened resistance to colds and flu by distorting the immune response. Therefore we are having a bad flu season. Is this wrong?
Could be. This data produced by UKHSA might provide a clue when it is updated next week.
https://app.powerbi.com/view?r=eyJrIjoiYmUwNmFhMjYtNGZhYS00NDk2LWFlMTAtOTg0OGNhNmFiNGM0IiwidCI6ImVlNGUxNDk5LTRhMzUtNGIyZS1hZDQ3LTVmM2NmOWRlODY2NiIsImMiOjh9
Note the excess deaths for heart attacks and strokes between April and November 22.
Many thanks indeed for the link!
It doesn’t reflect very well on me perhaps, but I’d like the vaxx side effects to become however severe and widespread they need to be for people to wake up and become angry. I have no interest in living in a world where these blatant crimes against humanity go unacknowledged and unpunished.
“London is double-jabbed 80% and triple-jabbed 64%, well below the rates in the South East, which is double-jabbed 90% and triple-jabbed 80%.”
Anyone familiar with the views of Professor Norman Fenton, as I’m sure Will Jones is, ought to know that those figures – estimating the percentages vaccinated and unvaccinated – are highly dubious, and probably greatly overestimate the percentages vaccinated and underestimate the percentages unvaccinated.
I think what Will Jones meant to say, but simply forgot, is that “According to the ONS, London is double-jabbed 80% and triple-jabbed 64%, well below the rates in the South East, which is double-jabbed 90% and triple-jabbed 80%.”
Yes, I assume their inaccuracy is consistent across the regions. The ONS are taking a long time to update their vaccine effectiveness estimates using more accurate 2021 census population numbers.
I almost fell off my chair. MSM are covering the excess deaths!
https://news.sky.com/story/excess-deaths-reach-highest-level-since-pandemic-peak-how-much-are-nhs-failings-to-blame-12780446
BBC News have covered excess deaths too, but just like Sky News, they don’t even mention the vaccines, because there isn’t even a remote possibility that the vaccines could be contributing to these excess deaths is what they want us to believe – or maybe not us, but the people they are banking on to remain more naive and gullible than we are:
https://www.bbc.co.uk/news/health-62648951
I hate to gloat but….
‘…though clearly the latest surge in excess deaths (unlike those in the spring and autumn) has no correlation with new booster doses.‘
A minor observation – at least one jab clinic in my local town was open and running right up until Xmas, with two chaps in high viz directing cars in the car park. If this reflects the case at national level then perhaps booster roll-out (plus the cold snap) remains implicated?