
There have been nearly 6,500 more deaths than usual in England and Wales from causes other than COVID-19 in the eight weeks since April 23rd, the latest data from the Office for National Statistics (ONS) show.
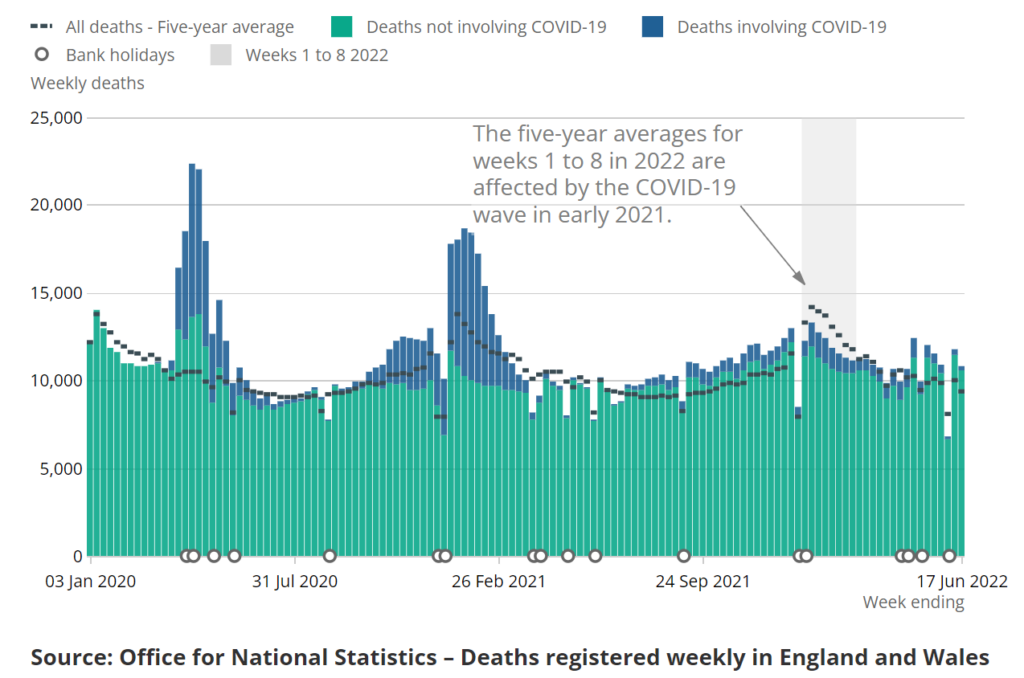
The weekly ONS mortality report shows that in the week ending June 17th 2022 there were 1,444 deaths registered above the five-year average, which is 15.4% above average. Of these, 264 involved COVID-19 and 161 were due to COVID-19 (where COVID-19 was recorded as the underlying cause of death on the death certificate), leaving 1,283 from underlying causes other than Covid. Added to the number of non-Covid excess deaths from the previous seven weeks gives a cumulative total of 6,466 deaths above average with an underlying cause other than COVID-19 registered since April 23rd 2022.
The chart below from the ONS depicts the data since the start of the pandemic, though note that the deaths involving COVID-19 in blue overstate the number of Covid deaths, particularly since the arrival of the Omicron variant, as they include those from a different underlying cause.
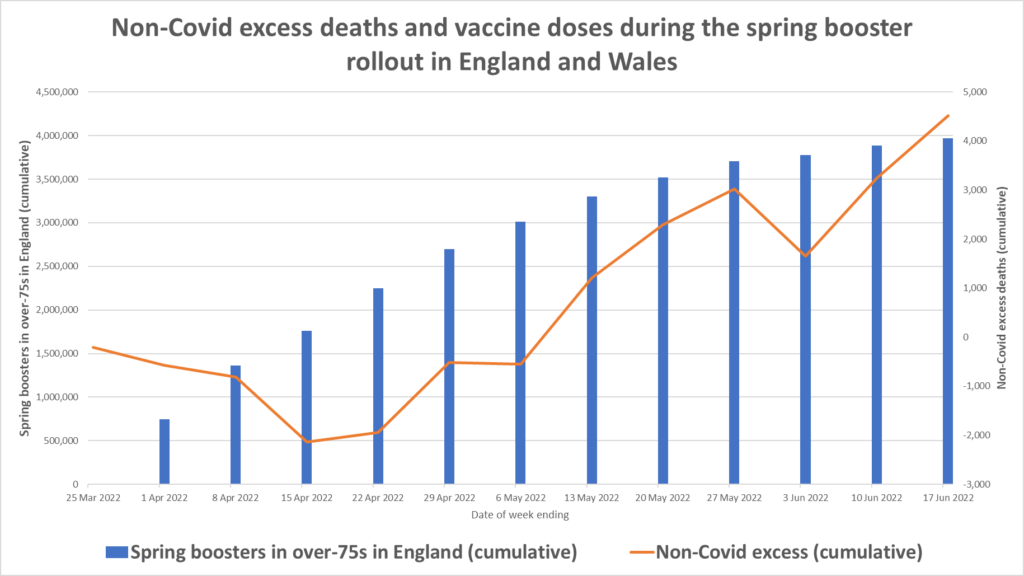
The spike in non-Covid excess deaths over the last two months coincides with the spring rollout of fourth doses to the over-75s, which began around the end of March.
To help visualise this, I have plotted the cumulative number of booster doses distributed to over-75s in England during the spring booster campaign (blue) and the cumulative number of non-Covid excess deaths in England and Wales (orange) since the week ending March 25th. The correlation is striking. Note that we would expect a lag between vaccine doses and deaths due to vaccine injuries both because death following an adverse event is not always immediate and because of death registration delays. The dip in deaths in the week ending June 3rd is owing to bank holidays affecting registrations.
Here are the data used for the chart, which come from the ONS and UKHSA.
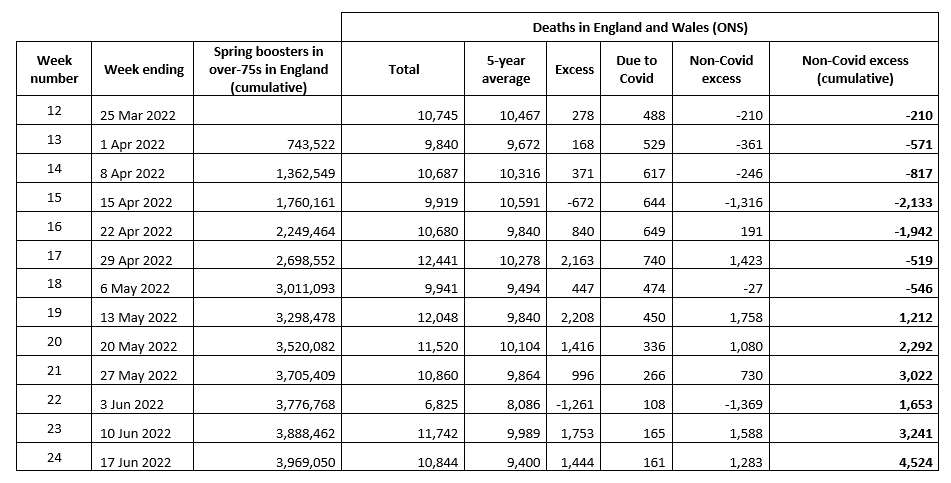
The UKHSA has registered around 4 million booster doses distributed to over-75s since March 21st up to June 19th. If all the non-Covid excess deaths were in the over-75s and caused by the vaccines this would be a rate of around one death per 600 doses – though that is an upper limit as some of the non-Covid excess deaths are in under-75s (around 80% of the non-Covid excess deaths in May were in the over-75s and 20% in the under-75s) and not all will necessarily be due to vaccine injury. Some will be due to the problems accessing healthcare during the pandemic, which are ongoing.
If vaccine injuries are playing a significant part in the non-Covid deaths this spring we should see non-Covid mortality return to closer to normal levels over the next few weeks now that the spring booster campaign is winding down.
This post has been updated to use vaccine figures specific to the spring booster campaign.


To join in with the discussion please make a donation to The Daily Sceptic.
Profanity and abuse will be removed and may lead to a permanent ban.
An “unqualified male” helped an 11 year old girl buy a “penis packer” and noone seems to think that’s a possible (definitely) safeguarding issue? That’s possible gross misconduct.
Staff admitting insubordination (definitely gross misconduct).
Female staff not using sanitary products which could lead to possible transfer of bodily fluids, breach of health and safety (definitely gross misconduct).
It’s time to start sacking head teachers who can’t control their schools…
Hear, hear.
Schools are being infiltrated by pedophiles, basically.
Indeed, but this lot are even worse than the grubby scoutmasters and sweaty vicars of yore, because they actively and angrily believe in what they’re up to. They think it is not only right and proper but that objections are evil. The older cohort was perverted in its habits and was rightly punished when found out; but they retained a basic knowledge that their actions were about as wrong as an action can be. This lot are perverts to the very core of their conscientious being and hence much, much more dangerous. What did Solzhenitsyn say? For real evil, give people an ideology…
I don’t think there’s anything that better exemplifies how sick our society has become than the normalised abuse of children. Children are being sacrificed for political reasons and we’re standing by and letting it happen. And that includes me… and, most likely, you. Time we stopped pointing fingers and actually did something.
These people are truly sick in their heads.
Time to start a crowdfunder to pay for some lawyers to disable what some lawyers enabled.
Yes. But…
The only people who seem to benefit from this is the group collectively known as ‘lawyers’.
Students pick you up (staff/me) if accidentally misgendering another pupil. I try to use Christian names in place of pronouns as a strategy (which are often changed anyway to non male female, like George is either) I will therefore avoid they or them but it takes a real concentration and I can slip up and say she or he.
There have been lessons where what all the genders are taught, so students believe it.
The reason I try avoid they or them is because one day I think these youngsters will look back at schooling and will blame adults/education for embedding their confusion and would have preferred support to live and joyfully embraced the biological sex they were born as.
I carefully do not comply with preferred pronouns without being called out myself because I think it is in the interests of the students mental and health well being just my view. I think I am maybe a lone voice but is a taboo to discuss openly so not sure!?
but it can be noticed and one has to navigate it. FSU has guidelines about pronouns so when I was called in to explain myself this helped.
Students wellbeing is my goal.
My goodness, you must be exhausted at the end of a day.
How do you keep this up?
And should you?
Thank you for your reply
yes as you say exactly, but it has been meaningful for many years in other pro active professional aspects. Lots of good experiences!
It is a realty for perhaps a small minority of staff, still working in schools and who are coming towards another chapter which may be earlier than expected, as a result.
If Labour get in it will not be worth the risk to stay.
Let’s call a spade a spade: This is not teachers grilling pupils about gender, it’s people who’ve been hired as teachers due to a total failure of sensible HR procedures pressuring (prepupuescent) pupils to declare themselves to be somehow at odds with their sex.
“it’s people who’ve been hired as teachers due to the success of
a total failure of sensibleHR procedures that create an unstable environment, instil fear and uncertainty, and fragment the wider society”Slight rewording but I imagine these HR procedures are little different from those creeping into the private sector.
Taking over HR was obviously a necessary precursor to hiring people who run around with blood-soaked pants to force pre-teen children into conversations about menstruation in lieu of teachers, IOW, the people who took over HR succeeded (so far) in what they’re trying to accomplish. But that’s not what they were supposed to accomplish, namely, keep the sexual perverts out and not bring them in.
Quote from The Office (the American one): “HR is a breeding ground for monsters”.
For God’s Sake – Parents everywhere: Take you children out of school!
I agree!
My children are mid-twenties, so I don’t have to make decisions about schooling, but I would definitely look at free schools or else home schooling. Maybe parents can join up and share home schooling?
The Not-a-Conservative-Government could stop this tomorrow – if it wanted to.
It doesn’t.
Anyone who wears white linen with no sanitary products when they’re menstruating to stimulate discussion is mentally ill as well as unhygienic and shouldn’t be allowed to teach. I wonder what the rest of the staff make of it all – or are they in agreement with that approach?
I was actually wondering if this entity uses toilets at all or if she’d also prefer ‘discussions’ about other bodily execretions. I don’t think this should be called mentally ill, by the way, as this would make it less of a conscious choice, just uncivilized and quite thoroughly so. People who ‘disagree’ with basic hygieny, doubtlessly while also being favour of 24×7 masking of pupils for her own protection from dangerous germs, obviously shouldn’t let loose on school children.
Where are the parents groups on all of this? ——-But I notice that Disney and other producers of media are starting to change course on this wokery crap. The new Snow White film is apparently going to revert to using dwarfs instead of assorted other inclusive characters, and Unilever are going to stop with their social justice preaching. I had to ask my wife if she would stop using Dove because of that disgusting TV advert where they had black women dressed in business suits staring in utter contempt at the camera.
Thanks to the Politicians