I headed PHE’s Antibiotic Resistance Monitoring and Reference Lab from 1998 to 2011. NHS hospital labs would send unusually-resistant bacteria to us for investigation. We’d confirm or refute the claimed resistance, investigate its mechanism, advise on treatment and assess any emerging public health threat.
Over 13 years my lab documented the rise of MRSA, of super-resistant gonorrhoea, and of ‘opportunist gram-negative bacteria with a particularly nasty antibiotic-destroying enzyme dubbed ‘New Delhi Metallo’ (NDM) because many early cases were in folks recently hospitalised in the Indian sub-continent.
When a new resistance problem was expanding sharply, I’d be summonsed to brief the Agency’s higher management. I could then guarantee that someone would suggest mathematical modelling. So, I’d meet with the modellers and outline the variables. NDM enzymes, for example, are carried by loops of DNA, called plasmids. These can transfer among bacteria, spreading the resistance. Within species NDM reached multiple strains, some more spreadable than others, and some good at living innocuously in the gut before finding their way to the urinary tract or, following surgery, to the abdominal cavity, where they’d cause difficult-to-treat infection.
After a while, the modellers and I would agree that the problem wasn’t tractable to modelling and I, together with epidemiology colleagues, would go back to tracking its actual progress. This was impossible to predict. Some problems were flashes in the pan; others grew to be substantial and ineradicable. We stopped advising ciprofloxacin for gonorrhoea when resistance crossed 10%. Subsequently, the rate rose to 40% and remains there two decades later, despite little use of ciprofloxacin in the infection. We instead advised doctors to use cefixime but abandoned that in turn when resistance hit 13%. Unlike for ciprofloxacin, cefixime resistance began to fall away almost as soon as use ceased. It’s now below a couple of percent.
As to why these trajectories differ so much, I really cannot say, except for proposing that gonococci biologically ‘like’ being ciprofloxacin resistant whereas cefixime resistance stresses them.
Sometimes, for amusement, I’d ask the modellers why it was possible to write a program to outwit a chess grandmaster but not to reliably predict winners at a race meeting, even a tin-pot one with six nags per race, half of them no hopers. It ought to be easy for modellers to bankrupt bookies, I’d opine. Why don’t they? The answer was that horses were complex and unpredictable. Too many variables again, whereas the moves of chessmen are finite and follow pre-defined patterns. Our modellers lacked the temperament of betting men too, I felt, leastways with their own money.
Which brings us to COVID modelling, on which lives and livelihoods (though not those of modellers, nota bene) have been bet these past 18 months. Many have written on how the modellers’ predictions haven’t been met – for example, with first-wave COVID deaths in lockdown-free Sweden more than ten-fold fewer than predicted by the Imperial model. And now I sense that the modellers are less confident themselves.
Since Freedom Day in July, we’ve had predictions from Prof Ferguson alone that “cases would hit 100,000 per day” and then that the pandemic would be “over by October”. More recently we’ve had a boast that while suppression policies had their “downsides” they had proved “very effective” at reducing mortality over the last two years. Then, this week, when the pandemic was supposed to be over, Prof F has warned that Plan B, with masks, vaccine passports and WFH will soon be needed. All this strikes me as ad hoc guesswork based on short term trends, not modelling at all.
Closures and restrictions, if enforced, cause untold damage to real lives and real livelihoods. So, it is time to call the modellers out and to set a test, before they have the chance to inflict more harm. Medics, nurses, physios, medical lab scientists, and clinical scientists all must demonstrate competency to be licensed. There is no such regulation for modellers. Yet their advice, adopted by the Government, affects millions whereas a bad doctor can only harm one patient at a time.
So, in the absence of regulation, let me set a challenge.
Consider the 1889-94 ‘Russian Flu’. This was the defining pandemic of the first globalised age, carried internationally by steamships and transcontinental express trains. Although called ‘Flu’ it may have been coronavirus OC43. OC43 putatively split from a bovine coronavirus in the late nineteenth century and remains with us as a common cold coronavirus. One reason to think the pandemic wasn’t influenza is that there were four peaks over five years, which is far longer than for any influenza pandemic before or since.
If it was OC43, it is the best model available for COVID-19.
The pandemic closed offices and schools, but only briefly and ad hoc. Life went on. Gilbert and Sullivan’s Gondoliers opened as the first wave hit in December 1889, playing to packed houses while Lord Salisbury, then the PM, lay sick, and closed just before the second wave; Prince Albert Victor – second in line of succession – succumbed in January 1892, victim of the third wave, but Lady Windermere’s Fan opened unperturbed the following month. There was no vaccine and a German microbiologist, Pfeiffer, caused confusion by blaming a bacterium, Haemophilus influenzae. Maybe the virus evolved and peaks reflect variants? Nowadays OC43 has two pools of types with only partial cross immunity.
Now, look at the graph below, which I’ve constructed from data in Vol 2 of Creighton’s History of Epidemics in Britain, a classic of great detail, covering 664 AD to late 19th century. Fortuitously, Volume 2 went to print as the final wave of the 1889-94 ‘Russian Flu’ ended, and includes contemporaneous details of London deaths, which I’ve graphed as a percentage of all London deaths. These are underestimates, for some deaths were booked as pneumonia or bronchitis, particularly in the first wave. Iffy statistics are nothing new. For weeks where there is no bar, deaths fell to negligible levels. Nationally, the toll was 125,000 from a population half of today’s, making the pandemic deadlier than COVID-19 to date.
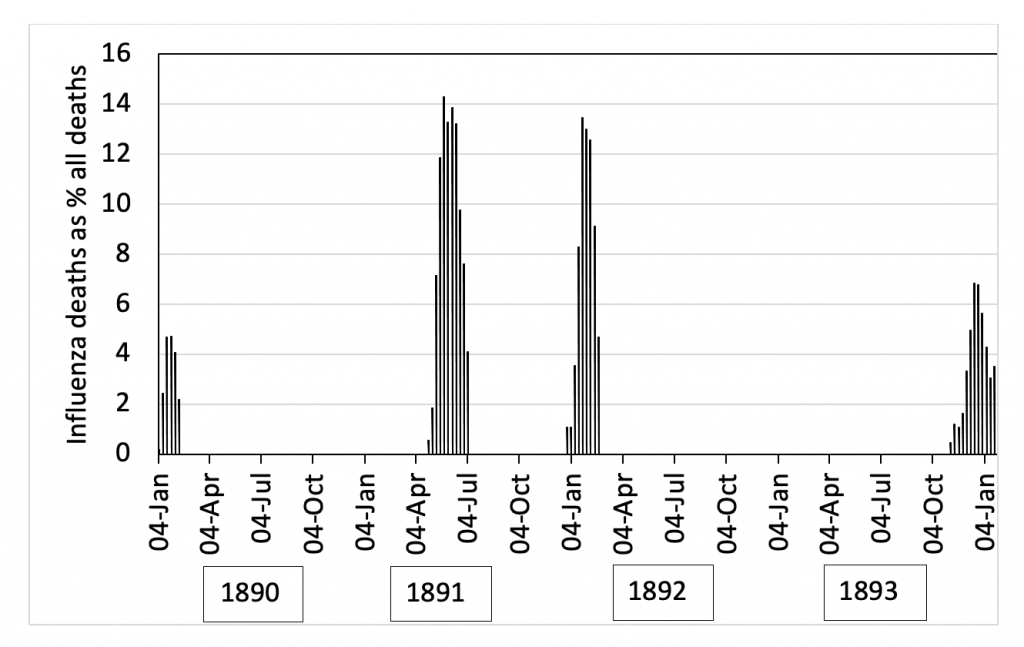
From all my experience with the antibiotic lab I maintain that the graph is a warning against trying to predict the unpredictable. The peaks are clear, but their rhyme and reason isn’t. So far as I can see, only descriptive qualitative points can be made. First, exponential rises never continue indefinitely, but always top out. Secondly, the interval between peaks is variable: three came in winter but the second was in the spring. Third, deaths could fall to zero then rise sharply. Last, although immunity of a sort must have been building in a crowded city, the virus still drove a mortality peak after four years.
All this resonates for COVID-19. Exponential rises don’t go on for ever, instead topping out even if little is done, as seen recently in Florida. Peaks repeat, separated by deep troughs, with the virus mistakenly thought to have disappeared, as in the Czech Republic last summer and India last Christmas. Both countries afterwards took big hits. There is seasonality, but it isn’t absolute, with the Delta variant spiking in the northern summer, just as the Russian Flu’s second peak came in the May. Somewhere, beneath the surface, we are creeping towards a dynamic equilibrium just as we were, no doubt, in 1889-94.
So, to the exam question which I think all Covid modellers should answer:
Examine the graph. Then, USING ONLY DATA AVAILABLE UP TO JULY 1891 (i.e., as far into the 1889-94 pandemic as we presently are with COVID) devise a mathematical model (not a qualitative speculation) to account for the peaks up to that date and to predict the size, timing and duration of the two subsequent peaks. Explain why there were no further peaks after 1894.
I’m sure the Daily Sceptic will be happy to publish any convincing and comprehensive responses that come in. In the meantime, let us have no more talk of lockdowns until modellers can prove their skills and competency by showing how the death waves of a previous pandemic could have been predicted accurately. They will find numerous relevant pre-July 1891 articles in the BMJ and the Lancet among other sources.
This is a small ask considering the costs that any further lockdown, predicated on their modelling, will inflict upon all of us.
Dr. David Livermore is Professor of Medical Microbiology at the University of East Anglia.