by Sarah Williamson BSc Dip ION (Dist.)
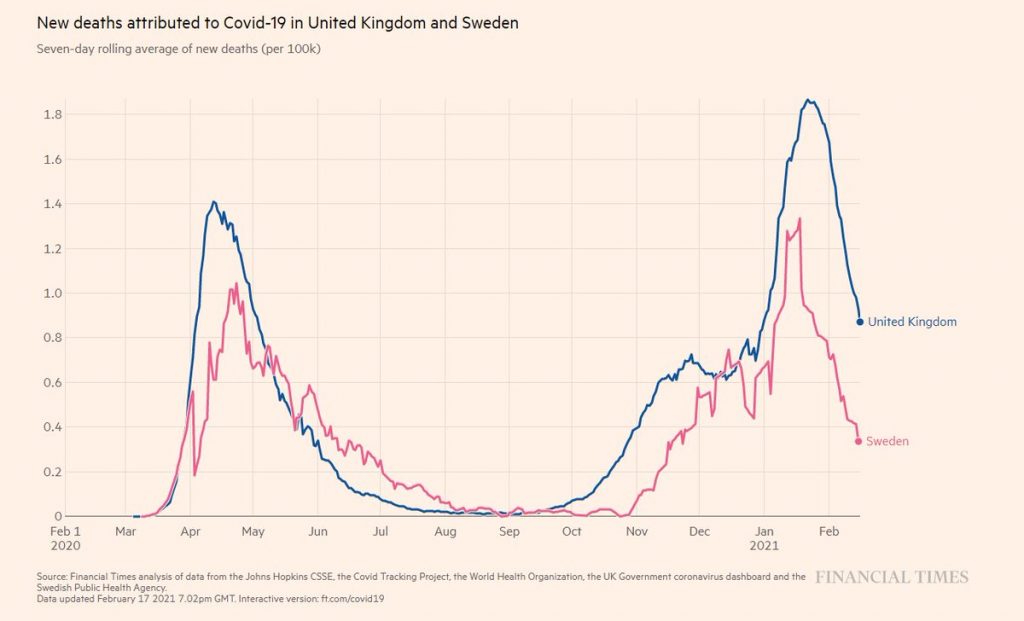
Coronavirus, a year ago, seemed like something peculiar to Wuhan in China – Oh! How we might long for those days. Since then, like most countries across the world, the UK has pursued a strategy that began with “three weeks to flatten the curve” and has stretched out to restrictions for the best part of a year?
The aim of the UK strategy was to postpone COVID-19 deaths until an effective vaccine became available and to reduce the likelihood of the NHS becoming overwhelmed, allowing surgeries and treatments to continue. The mantra has been “Save lives; protect the NHS”. The real question now is did we save lives and protect the NHS? The question we need to answer is not are the hospitals busy, but did our strategy help reduce hospitalisations and deaths?
Our aim should be saving the most lives, not just COVID-19-positive lives and reducing NHS admissions.
What did the WHO guidelines for a pandemic recommend and why did we do something else?
In October 2019, the WHO guidelines for a respiratory pandemic suggested the following – regular hand washing, respiratory etiquette (i.e. don’t cough or sneeze on people), face masks for symptomatic people, regular cleaning of surfaces, open windows and doors and isolate the sick.
Contact tracing, once the disease has taken hold, was not recommended. The quarantine of exposed individuals was not advised. Border closures were not recommended. School closures were advised only under extreme circumstances and only after careful consideration of the consequences for the wider community. Lockdown of healthy individuals was not mentioned.
So where did the idea come from? Did we import the idea from the Chinese, who exported pictures of a ghostlike Wuhan? Was it this, coupled with the fear generated by the press stories of a ‘killer virus’ spreading uncontrolled throughout the world? No longer in far off China, but now here, in Europe. With reports of deaths in all age groups – no-one was safe. The ‘three weeks of restrictions to flatten the curve’ seemed at least reasonable to most, whilst hospitals geared up.
Who did it affect and why did we have such a peak in spring 2020?
SARS-CoV-2 is recognised as a seasonal virus, like many other corona viruses responsible for the common cold. In the UK in the spring the virus spread rapidly killing the vulnerable, particularly those in care homes, causing a highly unusual spike in deaths.
Notably the viral transmission rate, from the moment we started charting it, appears to have already been decelerating (this was highlighted by Nobel prize winner Sir Michael Levitt). This is a mathematical proof, one that is easy to reproduce, for example plotting the difference in the natural logarithm of the weekly fatal infections in London.
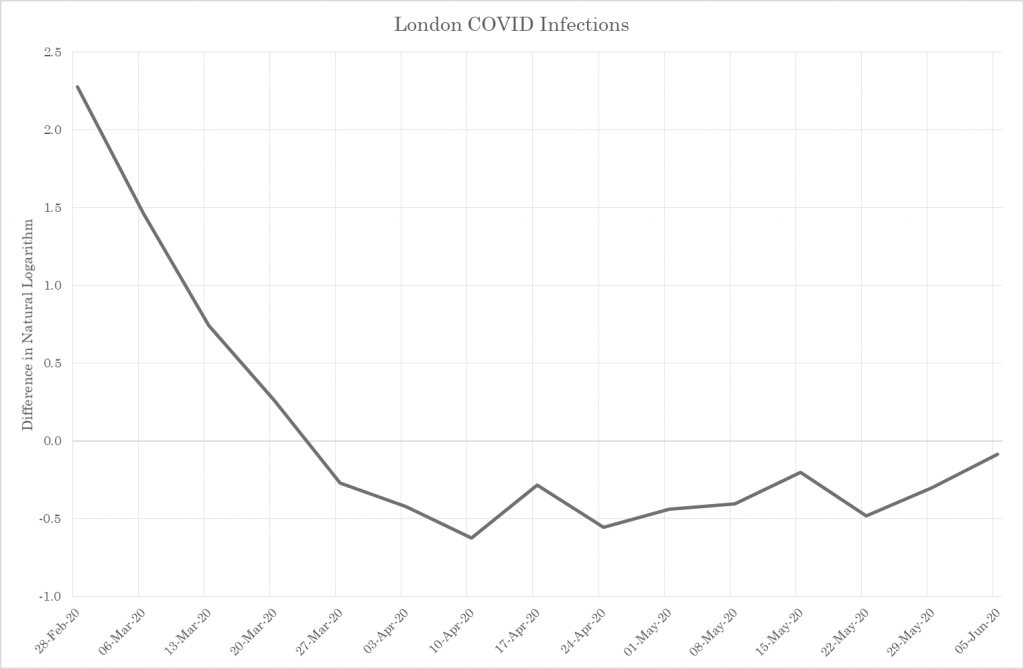
Figure 1 – COVID Spread Rate
COVID-19 is likely to have been passing unnoticed through the population earlier in the autumn of 2019. This is backed up by evidence from Spain. COVID-19 was found in Spanish sewage in samples from March 2019. The virus was appears to have been firmly established in Europe a long time before the initial cases were recognised. Too late for test and trace and the closing of borders to be an effective tool.
Why did some countries have higher death tolls than others?
There are three key factors affecting the death tolls in different countries and these, perhaps surprisingly to some, they are not related to severity of restrictions put in place by the Government. The first is the age and health of the population the second is the severity of the previous respiratory virus season and the third is how we record the COVID-19 deaths.
Age and Health of UK population
The UK population is one of the unhealthiest in Europe. In 2019 the five leading causes of lifestyle related diseases (heart disease, strokes, lung cancer, chronic obstructive pulmonary disease, Alzheimer’s and other dementias) killed a HUGE 263,100 people.
Type 2 diabetes affects an estimated 4.8 million adults in the UK; that is about 1 in 11 adults. Metabolic syndrome (characterised by high fasting blood glucose, high blood pressure, obesity and high trigylcerides) is likely to be present in 1 in 4 adults in the UK. Two thirds of the adults in England are overweight or obese; these factors increase the risk of a more severe dose of COVID-19.
Previous respiratory season low death rates.
The UK has been lucky. We lost far fewer people to flus in the winter season of 2018/19 than expected. This means, however, that the susceptible ill and elderly coming into 2020 were a much higher percentage of the population in comparison with those countries that suffered a tougher previous respiratory season. The UK had a high at-risk population right from the start of the pandemic.
How we recorded deaths.
In autumn of 2020 I lost my friend to a shocking heart attack at the age of 49. He spent 10 days in critical care with the amazing NHS staff doing everything in their power to save him against the odds. He tested negative upon arrival for COVID-19, but had he tested positive during his stay he would have been recorded as a COVID-19 death, despite dying from the injuries caused to his body and brain by the heart attack. The statistics vary but, nosocomial or hospital-acquired COVID-19 infections account for approximately 17-25% of hospital ‘admissions’ for Covid. The really important question here is should all these deaths and admissions be recorded as deaths attributed to COVID-19?
What is significant here is that respiratory excess deaths in the winter over that last five years normally account for around a third of all winter excess deaths. Notably deaths from other key diseases appear to have dropped off significantly. Cerebrovascular disease, chronic lower respiratory illnesses, dementia and Alzheimer’s, influenza and pneumonias and ischaemic heart disease have all seen rates well below the five year average over the summer and now appear to be lowering further, rather than rising as expected in the autumn-winter season. It looks although we are attributing deaths to COVID-19 rather than the true underlying cause.
Did the lockdowns actually stop or slow the infections?
Intuitively it makes sense. Telling people to stay in their homes and restricting the number of people they can see should lower infection rates. But does it?
We need to look at what actually happened, so back to the data. I was lucky to attend an online seminar given by quantitative analyst, Joel Smalley (a University of Toronto Dean’s List MBA), Dr Clare Craig (a diagnostic pathologist), and Dr Jonathan Engler, a qualified doctor and lawyer, on Covid facts. One chart they presented plotted the implementation of restrictions, alongside estimated dates that people picked up fatal infections and mobility data for the UK (from Google). It made it possible to investigate the following: Did the restrictions affect mobility? Did the change in mobility or behaviour reduce infections? The pictorial evidence was obvious. Mobility (to workplaces, public transit, retail and recreational establishments) was significantly altered. The course of fatal infections, however, was not.
The fatal infection curve on the graph shows absolutely no deviation from its natural course. There is no evidence of a correlation between any lockdowns, restrictions, tiers or other behaviour changes and fatal infection rates. In simple terms the restrictions had no impact on the coronavirus fatalities. It hasn’t saved lives, despite the hope, even the expectation, that it should.
This is evident in a very much simplified version looking at London Covid mortality alone using a fixed infection-to-death interval of 3 weeks. Transmission of fatal infections starts to slow in London two weeks before lockdown #1 and there is no change in the rate of deceleration at any point before transmission stops naturally at the end of season, as we saw clearly in figure 1. When transmission restarts in the autumn, the only significant inflection is an increase that occurs on the 20th November 2020, right in the middle of lockdown #2.
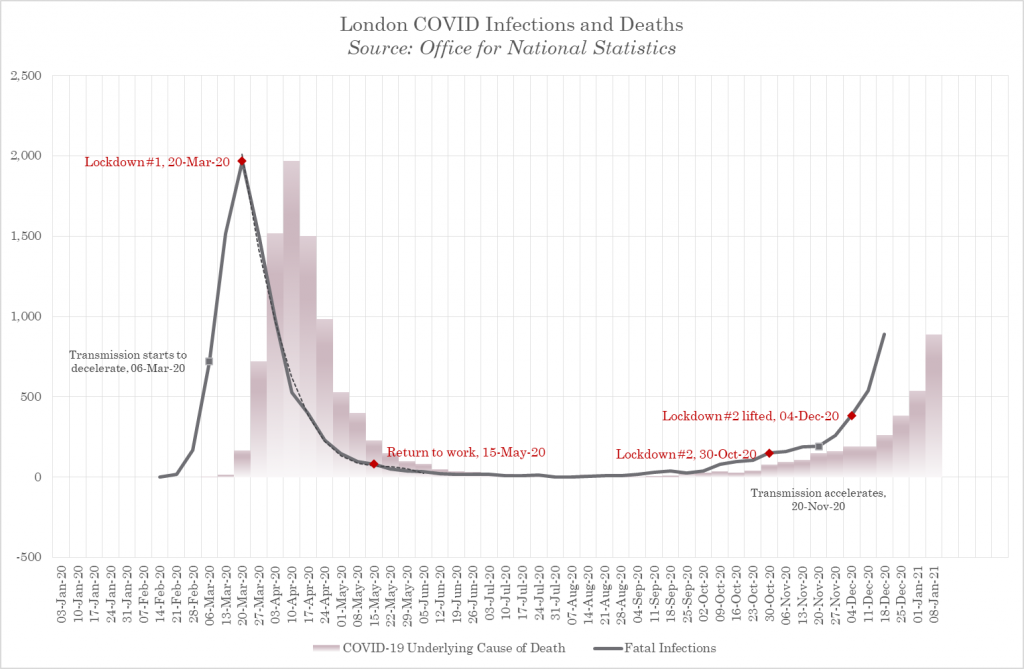
Figure 2 – Fatal Covid Infections and Interventions
This is now backed up by over 30 studies that highlight lockdowns don’t lower COVID-19 deaths. Take a look at this for example.
Why have the lockdowns and restrictions not worked?
The idea that introducing lockdown measures should reduce transmission doesn’t pan out in reality. Why could this be? One reason highlighted in the minutes from the SAGE meeting from March 16th 2020 suggested that “The risk of one person within a household passing the infection to others within the household is estimated to increase during household isolation, from 50% to 70%.” This means from early on in the lockdown cycle SAGE knew that isolating at home meant that the transmission within households would increase. Looking at the data, it appears that any infections slowed by lockdown measures have not been effective enough to overcome the increased risks of transmission within the home. If new more transmissible variants arise then the rate of transmission at home will rise further.
Some have suggested that we should tighten restrictions further. The effect would be to damage the food chain, healthcare access, medical supply chain and basic services such as rubbish collection etc. The result is likely to increase unintended deaths attributable to lockdown policies.
What factors do affect the viral spread?
A virus affects the population in two phases. The first phase is the epidemic phase where is spreads throughout the population, in the case of COVID-19 many of those vulnerable people, aged and metabolically damaged sadly died. The second phase of viral infection is when some level of community immunity has been reached, but a new smaller cohort of the population move into the vulnerable population as they age and/or their health declines.
We know the virus is seasonal. The summer brought respite as cases dropped off and life returned to some sort of normality. Why then was there an increase in autumn / early winter deaths above the levels expected for a respiratory virus at this time of year? Here we need to defer to Smalley who has broken down the peaks of viral outbreaks geographically. What he found was that the virus spreads more rapidly in densely populated areas and more slowly in areas with less dense and more remote populations. Quite obvious.
It is the combination of this physical geography and seasonal resurgence that resulted in the North East, the North West and the Midlands experiencing a double-whammy. The autumn allowed the resurgence of the the epidemic viral spread in those areas that missed it in the spring. These areas were more remote, less populated areas so the epidemic hadn’t managed to reach them in the spring. Areas that had already suffered the epidemic in the spring, now experienced normal endemic viral spread expected in any respiratory infection season (see Fig.5).
The arrival of summer paused the spread, but as autumn struck the back end of the epidemic curve continued its pass through these areas. If it was interventions that had slowed the spread of the virus, then is it realistic to assume that areas with low spring deaths suddenly threw caution to the wind and broke the rules in the autumn?
In fact, this movement of the second part of the epidemic wave (in the winter) is apparent at the local authority level (see Fig.3 and 4). The mapping of fatal infections (darker areas are higher fatal infection numbers) shows spread of epidemic infection experienced in the autumn is seen in areas that experienced low spring infections and vice versa.
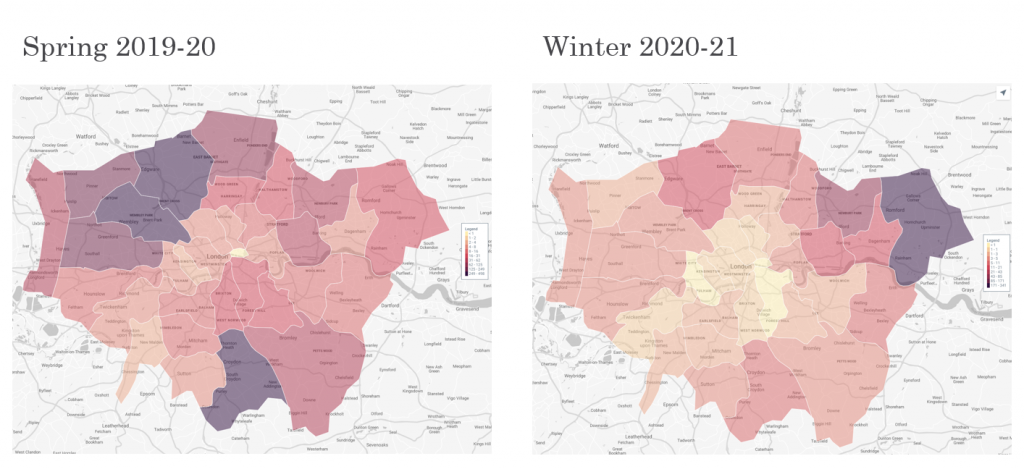
Figure 3 – COVID Mortality in London

Figure 4 – COVID Mortality in East Midlands
The virus has to pass through the population until community immunity (or a successful vaccine is rolled out) is reached and it then becomes endemic, i.e. it then becomes part of our normal winter respiratory disease pattern similar to influenza. What is important here is that we don’t conflate the epidemic wave of the virus with the later endemic phase ( Fig. 5). Smalley has shown, once the residual epidemic activity is separated out, that endemic COVID-19 death rates follow usual autumn/winter excess death levels that we experience every year.
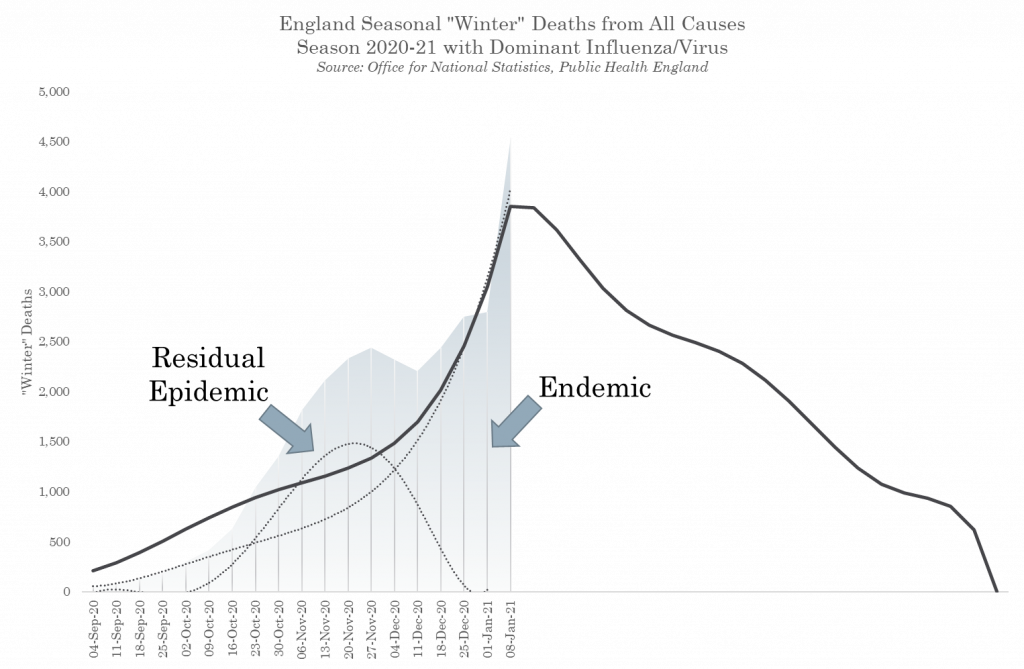
Figure 5 – Epidemic and Endemic SARS-CoV-2
What have lockdowns cost us?
The Office for National Statistics (ONS) estimate that during the spring lockdown in England there were between 13,000-15,000 extra deaths that could only be attributed to the lockdown policies themselves. These resulted from the from denial of medical treatments, suicides, people staying at home rather than seeking treatment in hospital for dangerous conditions such as strokes and heart attacks. These deaths as a result of policy have continued to rise. What is unusual about these deaths is that they appear to have risen according to the usual pattern in early Sept but then levelled off and remained constant at around 1,000 deaths a week.
These could be the collateral deaths that have been forecast by the Department of Health, Office for National Statistics (ONS), the Home Office and the Government’s Actuary Department These collateral deaths may eventually arrive at 250,000, due to the extraordinary reduction in the provision of non-Covid healthcare, like cancer diagnostics and treatments.
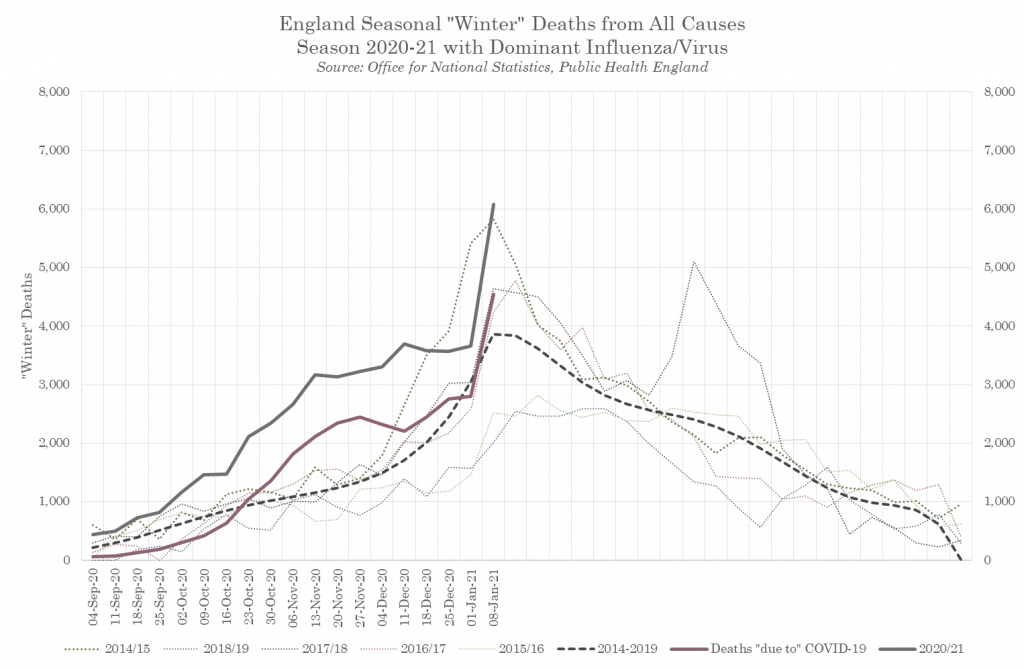
Figure 6 – COVID and non-COVID Excess Winter Deaths, England 2020/21
Moving forward the ‘collateral’ deaths of the policy response will almost certainly exceed the deaths due to the epidemic. The justification for those deaths is that up to half a million people would have died in the UK without intervention, but would they?
We now know that the model used by Professor Ferguson to predict the 500,000 deaths figure was wrong. Not for the first, second or even third time, Ferguson’s modelling was wrong by an order of magnitude. This hypothetical number of ‘saved lives’ cannot therefore be used to justify the direct collateral deaths, let alone the social and economic destruction these measures have caused.
What could we have done differently? The National Audit Office highlighted that the treasury had spent over £210 billion up until 7th of August 2020. This figure will have continued to grow over the subsequent months. Is it possible that allowing the economy to keep going and instead directing large swathes of cash to the NHS over the pandemic could have saved more lives?
Perhaps by increasing ITU bed, staffing and oxygen provisions over the summer alongside rapid training programs for staff. Speeding up research into off label uses of medications that reduce death or disease severity. Using rapid testing of staff before every shift to ensure they are not needlessly self-isolating for two weeks every time they are pinged by Test and Trace. Separating the care of Covid positive v. non-Covid patients by using the Nightingale hospitals thereby reducing in hospital transmission. The Government has put us on a war footing and saddled the population with a huge debt for little if no prevention of loss of life.
The burden of these Government policies has disproportionately fallen on the young, the poor and the old. Resulting in social isolation, missed education, job losses, a curtailment of future ambitions and small to medium sized businesses going bust. The true scale of the damage is yet to be experienced, but a decimated economy, postponed medical treatments, delayed diagnoses and widespread mental health problems only further threatens our NHS. Conversely, in trying to save it we have inadvertently put it in a more precarious position for many years to come and caused many more lives to be lost.
Sarah Williamson is a nutritional therapist with a degree in economics.


Donate
We depend on your donations to keep this site going. Please give what you can.
Donate TodayComment on this Article
You’ll need to set up an account to comment if you don’t already have one. We ask for a minimum donation of £5 if you'd like to make a comment or post in our Forums.
Sign UpLatest News
Next PostDerek Winton’s Response to Ferguson