
Apparently our next Prime Minister, Sir Keir Starmer, has set out five missions for his Government:
- Securing the “highest sustained growth” in the G7 group of rich nations, made up of the U.K., U.S., Canada, France, Germany, Italy and Japan, by the end of Labour’s first term;
- Making Britain a ‘”clean energy superpower”, removing fossil fuels from all of Britain’s electricity generation by 2030;
- Improving the NHS;
- Reforming the justice system;
- Raising education standards.
But this is the same fatuous nonsense the fake ‘Conservative’ Party has also been promising for the last 12 years while delivering none of it. So, there’s really no difference between our two major political parties.
Part of the reason that no party has delivered or will deliver any of this is, of course, due to the incompetence and cowardice of our self-serving politicians.
But there may also be a deeper reason why our country is declining: the fact that the first two items on the list, “highest sustained growth” in the G7 and making Britain a ”clean energy superpower”, may be mutually exclusive.
So I’ve designed a new game that will give hours of fun for all the family. The game is called ‘Growth versus Green’.
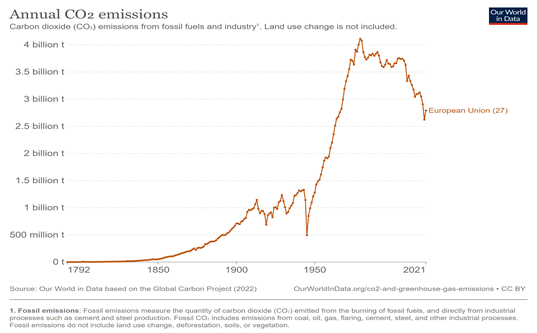
To start the game, you go to the Our World in Data website and choose any advanced Western country where the politicians are trying to reduce CO2 emissions by moving from cheap, reliable, efficient fossil fuels to expensive, unreliable supposed ‘renewables’ in order to save the planet from the imagined climate crisis.
Then you look for that country’s CO2 emissions. Here are CO2 emissions for the EU 27 countries:
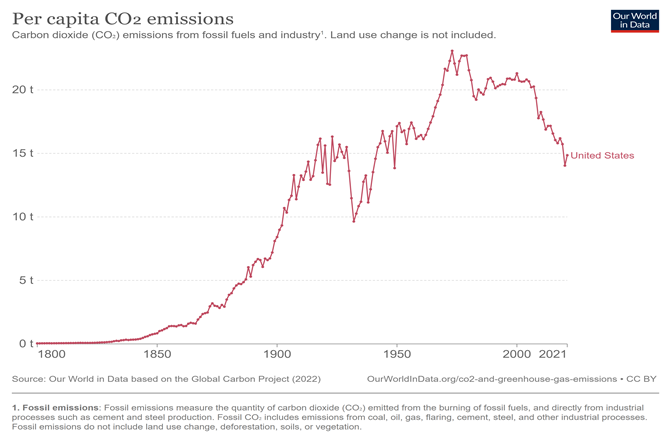
Here’s the USA:
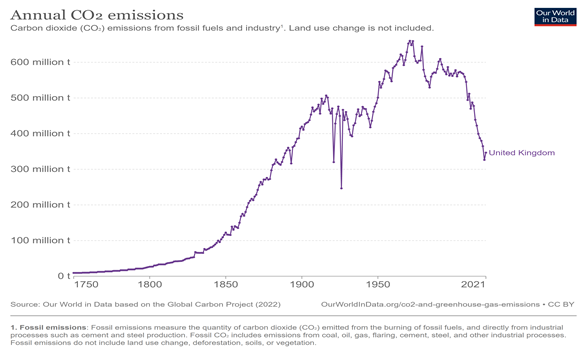
And here’s the U.K.:
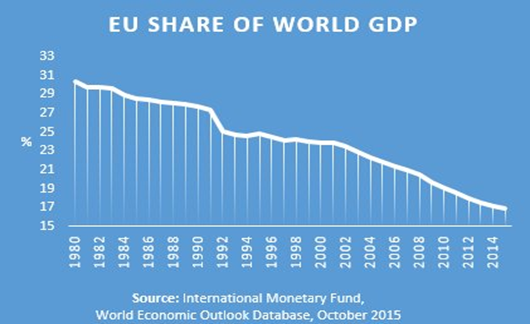
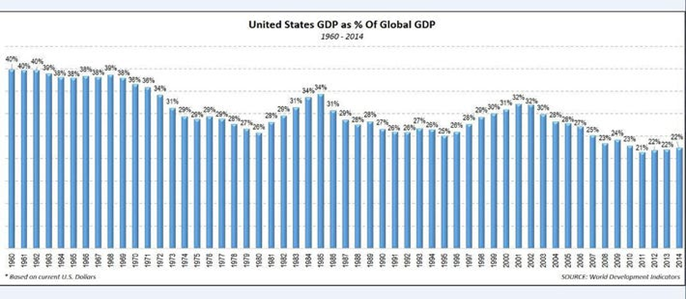
Next step in the game is to go to Google Images and get the chart for your chosen country’s share of global GDP.
Here’s the chart for the EU 27 countries:
And here’s the USA:
And here’s the U.K.:

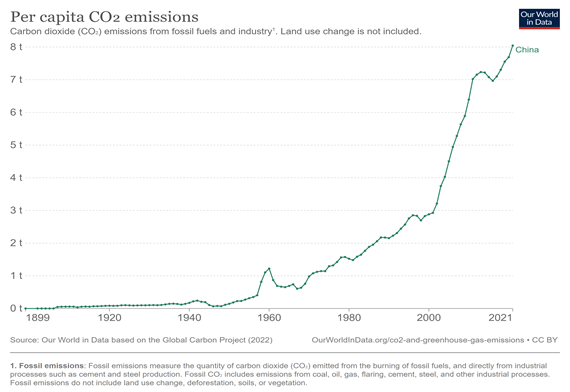
Now you choose a few developing countries and look at their CO2 emissions:
Here’s China:
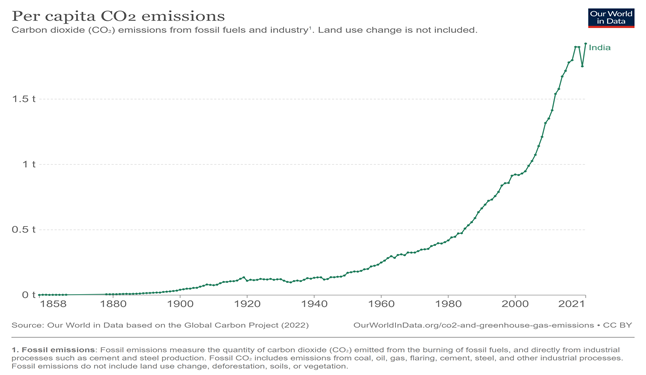
And here’s India:
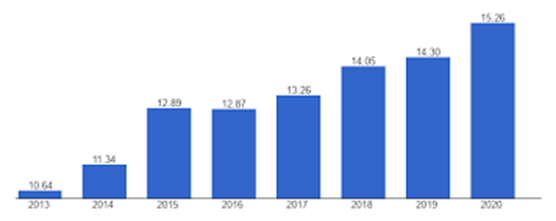
Then you look at their share of global GDP:
Here’s China:
And here’s India:
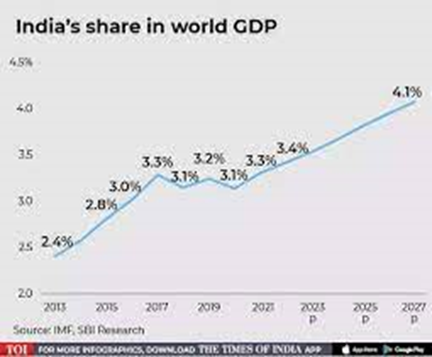
Once you’ve played the ‘Growth versus Green’ game, you’ll soon start to realise one very simple fact – countries with increasingly expensive and unreliable supposed ‘renewable’ energy are losing their share of global GDP and impoverishing themselves whereas countries with cheap, reliable fossil fuel energy are winning ever more of global GDP and becoming wealthier.
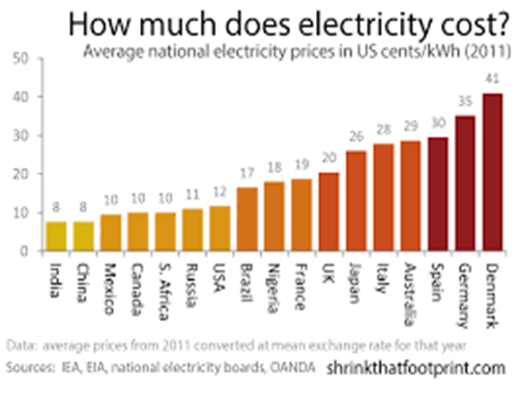
The basis for economic success is cheap, reliable electricity, and when Western countries have massively increased the cost their businesses and consumers pay for electricity to two to three times what businesses and households in countries like China and India pay, they are wrecking their own economies and immiserating their citizens.
As for claims by Western politicians that they’re successfully reducing their countries’ CO2 emissions in the ‘race to Net Zero’, this is rubbish. All they’re doing is exporting CO2 emissions and jobs and wealth creation to countries with lower energy costs.
Most dictionaries define the expression ‘mutually exclusive’ along the lines of: “related in such a way that each thing makes the other thing impossible: not able to be true at the same time or to exist together.” A clear example is the set of outcomes of a single coin toss, which can result in either heads or tails, but not both.
Anyone who’s played the ‘Growth versus Green’ game should realise that growth and green are mutually exclusive. Western politicians are deliberately, or at least foreseeably, impoverishing their own countries. But even more absurd is the fact that they are doing this to fight a supposed climate crisis that doesn’t even exist. We are in an interglacial period, the Earth is warming by about 1°C every hundred years, likely mainly due to Milankovitch Cycles, this is a totally natural phenomenon and nothing to do with levels of atmospheric CO2 and absolutely nothing our King Canute politicians do will change this natural process.
Going green is economic suicide in an attempt to fight a non-existent monster which exists only in the deranged minds of the climate catastrophists and their cheerleaders in the mainstream media.
David Craig is the author of There is No Climate Crisis, available as an e-book or paperback from Amazon.


To join in with the discussion please make a donation to The Daily Sceptic.
Profanity and abuse will be removed and may lead to a permanent ban.
https://biblehub.com/luke/15-7.htm
I have already posted this but it bears repeating as it appears to have been missed.
The lockdown restrictions played a direct result in the deaths of two very vulnerable small children that the public know of (there may be others), because they were forced to live with their abusers, and their extended family who were concerned about them being abused were not allowed to visit them, indeed, I think they were actually warned off visiting by police officers because the visits would breach the lockdown rules. Workers from the social care sector were also unable to visit these children, and had they been attending school the abuse might have been detectable and these children might still be alive.
All this, while the PM and his staff held numerous parties in Downing St and other government buildings.
No idea how the inquiry would resolve this one, but I would like to see them at least be required to try.
Yes, JRM, judging by his absurd pronouncements, is hoping the public won’t conclude that ‘partygate’ could have been avoided by not imposing lockdown in the first place.
Hedge Funds did absolutely fine during Lockdown. I doubt JRM would want the net wealth transfers from the poor to the rich to be quantitated as part of this Enquiry.
It would make for truly shameful reading.
What does that have to do with anything? Were they supposed to lose money deliberately? how would that have helped anyone?
Yes, they were supposed to lose money, by implication, according to him.
Of what relevance is that?
I have seen a drastic decline in the well being of people of all ages over the last few years especially the very old and very young. Huge cognitive decline in older people and a destruction of the emotional well-being of children. That’s what happens when all you care about is saving your own ass. Vera Britten wrote in Testament of Youth that one of the more subtle effects of war was to desensitise the soul to beauty. Calm simple fleeting evanescent joys that could be no more. This deadening tendency is in full operation now and can only accelerate. Like they say, all it takes for evil to flourish is for good people to do nothing.
Actually all that often happens to good people trying to confront evil is the total desensitisation of their souls to beauty. They have no idea how to fight psychopaths at their own game, you see….
It’s why most people are slow to anger, but when they rise, they make sure they don’t have to rise again for a very long time.
Agreed
Why would they?
You can bet your house on the fact that right now, behind the scenes, the same people who inflicted this freedom grab on us are working to skew the inquiry.
I’ve taken a great deal of interest in how these people stole the US Presidential Election in 2020. The cover up from media, politicians, judges, lawyers, big corporations and NGOs has taken place on an industrial and breathtaking scale.
Dig in for the fight of your life and don’t take a backward step.
“I’ve taken a great deal of interest in how these people stole the US Presidential Election in 2020”
Quite someting after two yrs the ny times finally says the hunter biden laptop is real.
Joe Biden has evidently outlived his usefulness.
Rumour has it that the cabbagey piss smell is too much even for the Democrats.
“When the hunter became the hunted…”
Sadly, it’s utterly meaningless as the FBI have had the laptop for almost two years now and done nothing with it. There was also at least one copy made of the HD, by the repair shop owner as far as I’m aware, so where is it?
Will the critical details on the laptop go the way of Hilary’s emails? Or is there actually anything of concern on the laptop.
I’m not convinced even Hunter Biden would be stupid enough to hand a laptop over for repair with pornographic and potentially illegal photographs on it, or intimate details of illegal dealings with a foreign power implicating his father.
If the Biden’s and the FBI are as corrupt as people maintain, wouldn’t it have been more prudent to have the laptop repaired by someone from the FBI on the quiet?
I don’t think Hunter Biden is stupid, but I’m not sure that he was sober enough to worry about what was on the laptop when he dropped it off.
I’d recommend reading ‘Laptop from Hell’, by Miranda Devine, if you haven’t already.
Corruption seems to be a way of life for the Bidens. 10% for the Big Guy!
‘I’m not convinced even Hunter Biden would be stupid enough’
He is a crack head, they aren’t renound for their wisdom.
Know many crackheads do you?
Repeat after me
THERE WAS NO PANDEMIC
Yes, exactly this. Important as the harms to children are, it’s not where we should be starting. The starting point is that characterising COVID as an unprecedented emergency was utter nonsense, on its face. Once that is recognised, the whole house of cards collapses. Arguing about the detail is just a rabbit hole from which we will never emerge with the truth.
Absolutely. Their excuse and their justification must be exposed and removed.
Otherwise all we will hear is, “Most regrettable of course – but because of the pandemic …”
“Lessons will be learned.”
It was decidedly more a pan(dem)ic.
the states motto “we protect children until it doesn’t suit us”
this is why its laughable when the state says it wants protect children from harms yet subjects them to nearly two yrs which could be described as phycological torture, if the UN described Assanges solitary confinement as akin to “torture” then the messaging from the media, forced mask wearing and confinement to homes with potentially an abusive parent etc could be also described as such.
It just contributes to a growing community of people who no longer have any trust in our government.
Yet again, anyone who has eyes, ears and a brain is going to be treated like a mug, with this preloaded, predestined and prearranged result inquiry. None of the real and important questions will be tabled, let alone discussed, with the effects on young people (not just children) being but one. Johnson will come out smelling of roses instead of horse manure, and the hangers-on like Whitty, Vallance, Ferguson and the rest of their gang will doubtless be lauded to the skies. I wouldn’t even be surprised to see a coat of whitewash on Hancock.
In short, the Establishment will close ranks, in hope of evasion, preferments, honours, money etc., whilst the public will, as usual, be treated like idiots or fractious children. It is corrupt beyond all imagining.
I think the first question that should be asked, and answered is, who, specifically, gave the instruction to ignore the WHO’s pre pandemic planning advice that lockdowns are not an effective response.
By that thread the whole jumper begins to unravel.
As far as I’m aware SAGE were not advsing in favour of lockdowns until after Boris imposed one. So if the fat Turk was not being told to impose a lockdown by ‘The Science’ why did he do it?
All that needs to be evidentially established.
Ever heard of a bloke named Ferguson?
Even before that the lessons from Exercise Cygnet were swept under the carpet by the then Minister of Health – Hunt the Cnut
I don’t have a problem with naivete. We are all profoundly more naive than we imagine. But seriously. How can anyone with any awareness assume that a public enquiry is going to yield results that run contrary to the narrative. You only have to look at previous examples of such enquiries and we all know the framework in which this matter will be discussed. They don’t even pretend to have intellectual credibility anymore. That’s the point. They have decided that at this moment the corporations must assert direct rule openly: the going direct reset. Far more significant than the ‘great reset’.Just consider the power dynamics that are prevailing and you will have a complete understanding of where we are now.
Q Why did 20,000 flu deaths disappear?
A Because they stopped lying about flu and started lying about something else
There was subliminal messaging from the get-go: shut the fuck up yes we all know its fake but we all know that it is necessary too. I saw that straight away. And as the financial crisis saw no signs of resolution it was necessary to deepen the narrative.
I am the proud owner of that Bob Moran cartoon. I daresay it will become the go to source in GCSE History textbooks in 50
years time when the truth of the ‘pandemic’ finally emerges.
Just sit back and watch the investors move from big pharma to the military industrial complex. Every step of the way they are stealing your labour and shoving it into their own pockets. How much more do you need for you to understand that you are living in slavery.
Why self isolation is not going to end anytime time soon in Wales
There is money to be made
Summary
The self-isolation support scheme is for workers who cannot work from home and must self-isolate. It is also for parents and carers with children who are self-isolating.
You must be working (employed or self-employed) to get the payment and need to claim within 21 days of your last day of self-isolation.
It should not affect any benefits you get.
Eligibility
You must have one of the following:
If you receive notification to self-isolate via the NHS COVID-19 app, unless TTP advise you to self-isolate you will not be eligible.
Before the self-isolation period, you must also be:
If you are not receiving one of the benefits you may still be eligible if it is determined you are facing financial hardship as a result of the loss of your income whilst self-isolating. An example of where an award could be made is where an individual has a net income of less than £500 a week
If your child has been told to self-isolateA parent or carer can also apply for a payment if their child has been formally told to self-isolate. You cannot get the payment if your child has been told to self-isolate by the NHS COVID-19 app.
To get the payment, they must attend school, further education or childcare (up to and including Year 11 or up to age 25 if they have complex needs) and have been formally told to self-isolate by NHS Wales Test, Trace, Protect service.
How to apply
Local authorities are receiving a lot of applications and this may mean your claim is delayed. To minimise delays ensure you provide all the information required to support your claim.
You can apply online through your local authority.
If you’re self-isolating because you’ve been identified as a contact by the NHS COVID-19 app, you’ll first need to register your details with the NHS Wales Test, Trace, Protect service before applying for a payment through your local authority website. Please note that if you are fully vaccinated you are not required to self-isolate as a contact unless instructed by TTP. Find out more information about how to apply through the COVID-19 app, on NHS COVID-19 app support.
What they did to children was indefensible, so no surprises they will seek to avoid scrutinising it.
That cartoon is rubbish. It should be parents who teach their children to read. Schools use “phonics”, also known as the best way to induce dyslexia. Strangely, many adults nowadays read very slowly, especially if they can’t move a finger along the written line.
And that’s why it’s a bad idea to let parents teach their children. Parents know what they know and don’t know what they don’t know and haven’t received any training in pedagogics. Some while back I was a Community Governor at a local senior school and was the head of the disciplinary unit. A pupil was due to be excluded and her Father accompanied her to the final hearing. When the exclusion was confirmed his response was “It don’t matter, I’ll learn her” QED?
It won’t be hidden. A twenty point drop in IQ isn’t really something that can be hidden. They will mainain that it was necessary to flatten the curve. Whether we like it or not the baby boomer generation holds the reins of power and they are neither the brightest or the most astute or the most compassionate.There is no way to pay these children back because their psychospiritual development has been damaged forever.
I’m sorry Will but none of the measures taken with regard to lockdowns, masks etc were proportionate in protecting the most vulnerable.
They were, in reality, inappropriate. They were used to create an impression of “something being done”; not much more than that, at the best.
“It was right that our pandemic responses focused on protecting those most vulnerable to Covid.”
Golly, a blatant lie.
it’s good to see new voices joining the calls for the harms of lockdowns to be properly addressed
There did seem a severe shortage of scientists and medics speaking up when it might have done some good. Lack of backbone I assume?
Lack of a family pile big enough to ensure a comfortable existence after their career was trashed, perhaps?
Looking after their jobs in the future, perhaps.
We don’t want a Public Inquiry.
We want to find out what happened and why.
We do want a Public Enquiry.
We just want its Terms and Reference framed by the Public, the Enquiry co-ordinated by a skeptical, independent member of the General Public and witnesses required to testify under oath, with zero ability of any Government Department, including MI5 and MI6, GCHQ and the 77th Brigade, to use any excuse whatsoever to cover up one single fact.
We would also like the Inquiry to have the power to seize assets from those whose decisions were so financially calamitous to the honest majority that it is they who should shoulder the primary burden of debt repayment.
You know, people like the BMGF, Pfizer, Moderna, Chris Whitty, Jonathan Van Tam, Patrick Vallance, SAGE, Boris Johnson, Matthew Hancock, the entire management of the BBC, ITV, Channel 4, Sky News, all the management teams and owners of every major national newspaper, with particular regard to Piers Morgan.
There is zero chance of anything honest and meaningful being disclosed.
All the powerful people have massive vested interests in hiding the truth, not least so they can do it all again.
What we need is a real life Sam Vimes to walk into the government and arrest them. They need to be brought to trial for what they have done to our children.
Maybe simpler to form an equivalent to the IRA targeting Covid criminals?
A real life Jack Reacher might be more effective
The outrageous and often puerile behaviour of the police during the pandemic should also be scrutinised. But it won’t.
The whole point of rigging the terms of reference of Public Enquiries is so that Governments and officials who need to be punished escape scott-free.
The time is now when the General Public determine the Terms of Reference for Public Enquiries, since it is they who have to pay for them.
Stop this criminal fraud of London upper middle class troughers scamming millions to produce whitewashes.
Children with special needs like my grandson who has cerebral palsy were dramatically affected by lockdown policies. Nurseries were supposed to stay open to provide for the ‘vulnerable’ children but our nursery manager decided otherwise claiming she had too few staff “because of Covid”. I blame the Nudge Unit that terrified these managers and brought out the worst in them. Every week we would ring asking when can he come back? It was a version of “ computer say no” and I’ve come across other private institutions like care homes with managers like this that ultimately are ‘jobsworths’and don’t try to find a solution.
And where were all these worthies when the totally unnecessary restrictions on kids were being implemented? Keeping their heads down and preserving their salary and benefits packages. Cowardly brastards.
Alternative public enquiry – by the public? It might be of some use rather than the establishment being judge and jury in its own case.
I think we’re being overly optimistic about the contents of this letter. Whilst it’s welcome that they are asking about the effects on children, they seem to accept that we had to lockdown and are more concerned about the earlier opening of hospitality venues. They need to take this one up with the pathetic teachers who refused to return when ordered to. Still no one ‘at the top’ seems to think there was anything actually wrong with locking down healthy people which is extremely worrying.
Not enough. It should include why we are vaccinating children from 5 and upwards, when it is clear from the manufacturers that the vaccines were for use on people 16 years and over, not 5years. The inquiry should investigate why the JCVI allowed this.