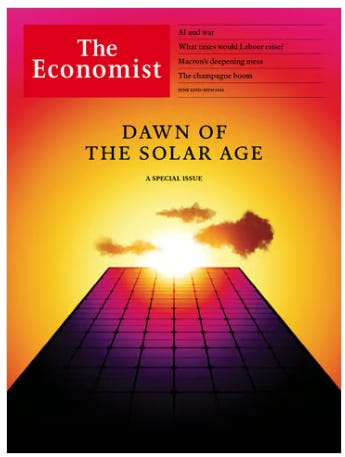
The Economist was breathlessly promoting solar power in its recent solstice issue, predicting that “exponential growth of solar power will change the world” and that solar power is going to be so huge that solar energy will become “humankind’s largest source of primary energy – not just electricity – by the 2040s”.
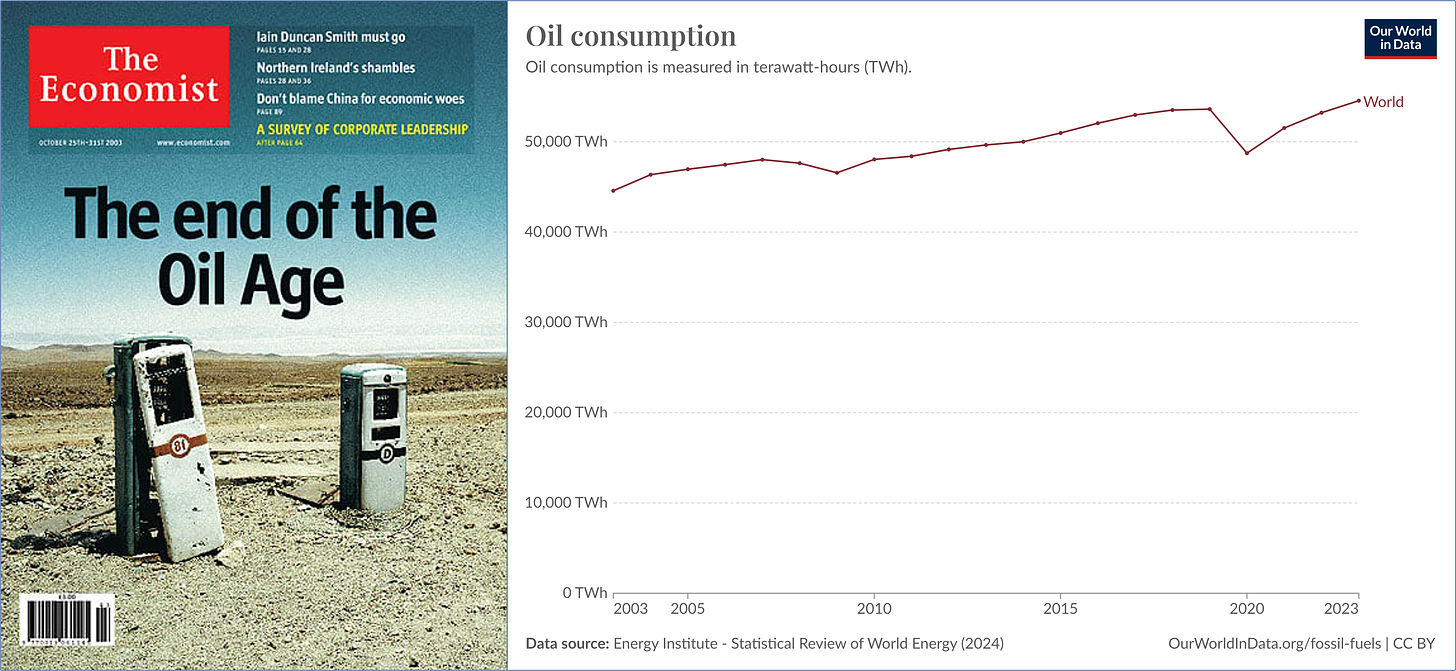
But the Economist is thought by some to be the ultimate contrarian indicator after it famously called the end of the oil age in 2003. As Figure 2 shows, that prediction has not worked out too well.
How realistic are the Economist’s latest solar power predictions and what might derail their forecasts?
How Fast is Solar Power Growing?
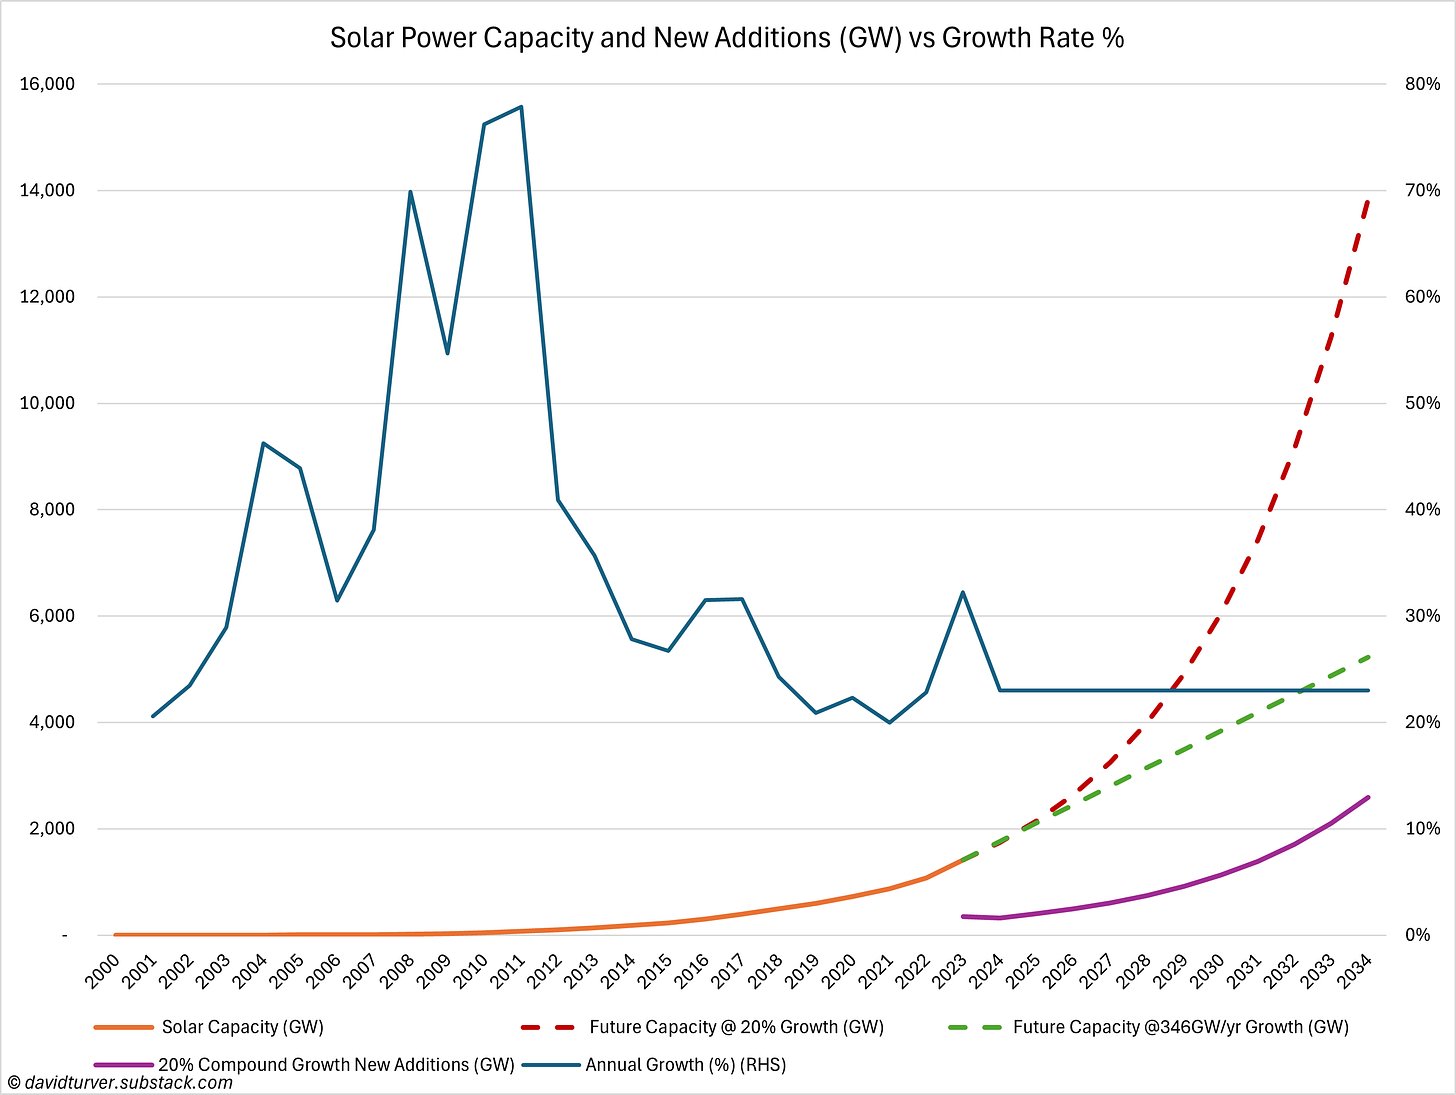
Figure 3 shows, using data from IRENA, how the installed capacity of solar power has increased since 2000 (solid orange line) and the annual growth rate (blue line). The dotted red line shows how installed capacity will evolve if it grows exponentially at the average growth rate for the past five years of 23% per annum. The plum line shows the annual capacity additions at the same 23% growth rate. The dotted green line shows installed capacity if growth is fixed at last year’s rate of 346GW per year.
The wonder of compounding at 23% per year means that by 2032 the annual capacity additions will be larger than the installed capacity in 2023. Let us consider the constraints on that growth.
Cost and Value of Solar Power
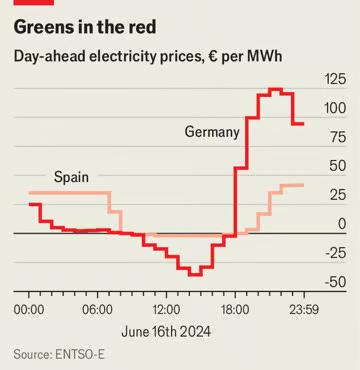
The first thing to consider is the value of solar power generation. Another article in the same issue of the Economist claims that Europe is facing a problem of “ultra-cheap energy”. After I got up from the floor after falling off my chair and stopped laughing, I delved a little deeper to understand why the author had come to that conclusion. It looks like the author has confused market value and cost (see Figure 4).
The Economist’s chart shows that day ahead prices do sometimes go negative on sunny days in Spain and Germany. The market reference price for solar power in the U.K. also reaches extremely low levels on sunny and windy days.
These apparently low prices reflect the market value of the energy generated, not the price we pay in our bills for that electricity. Surely the Economist realises that any enterprise that has to pay its customers to take away its output is not commercially viable. Solar farms can only operate because they rely on generous subsidies. As I have covered before, the latest Feed-in-Tariff report for 2022-23 which is mostly solar shows the average total payment was around £193 per MWh and CfD-funded solar plants currently receive over £110 per MWh. We pick up the difference between low or even negative market prices and the subsidised prices through our bills.
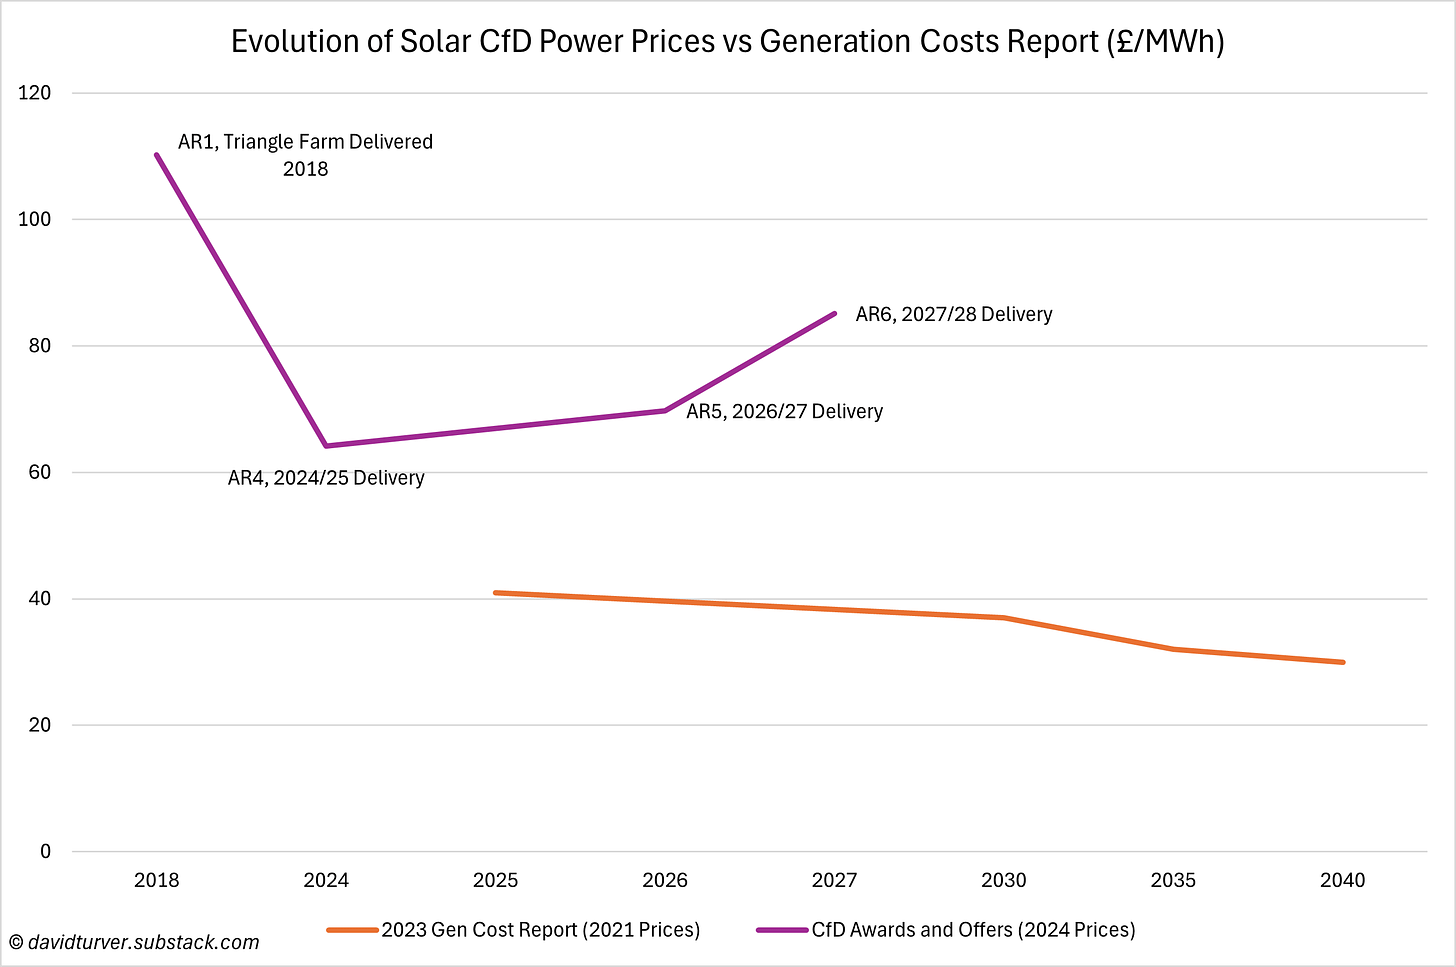
Moreover, despite the Economist claiming and models from Government showing the cost of large-scale solar power falling over the coming years, the prices offered in the various allocation rounds have risen sharply since AR4, see Figure 5.
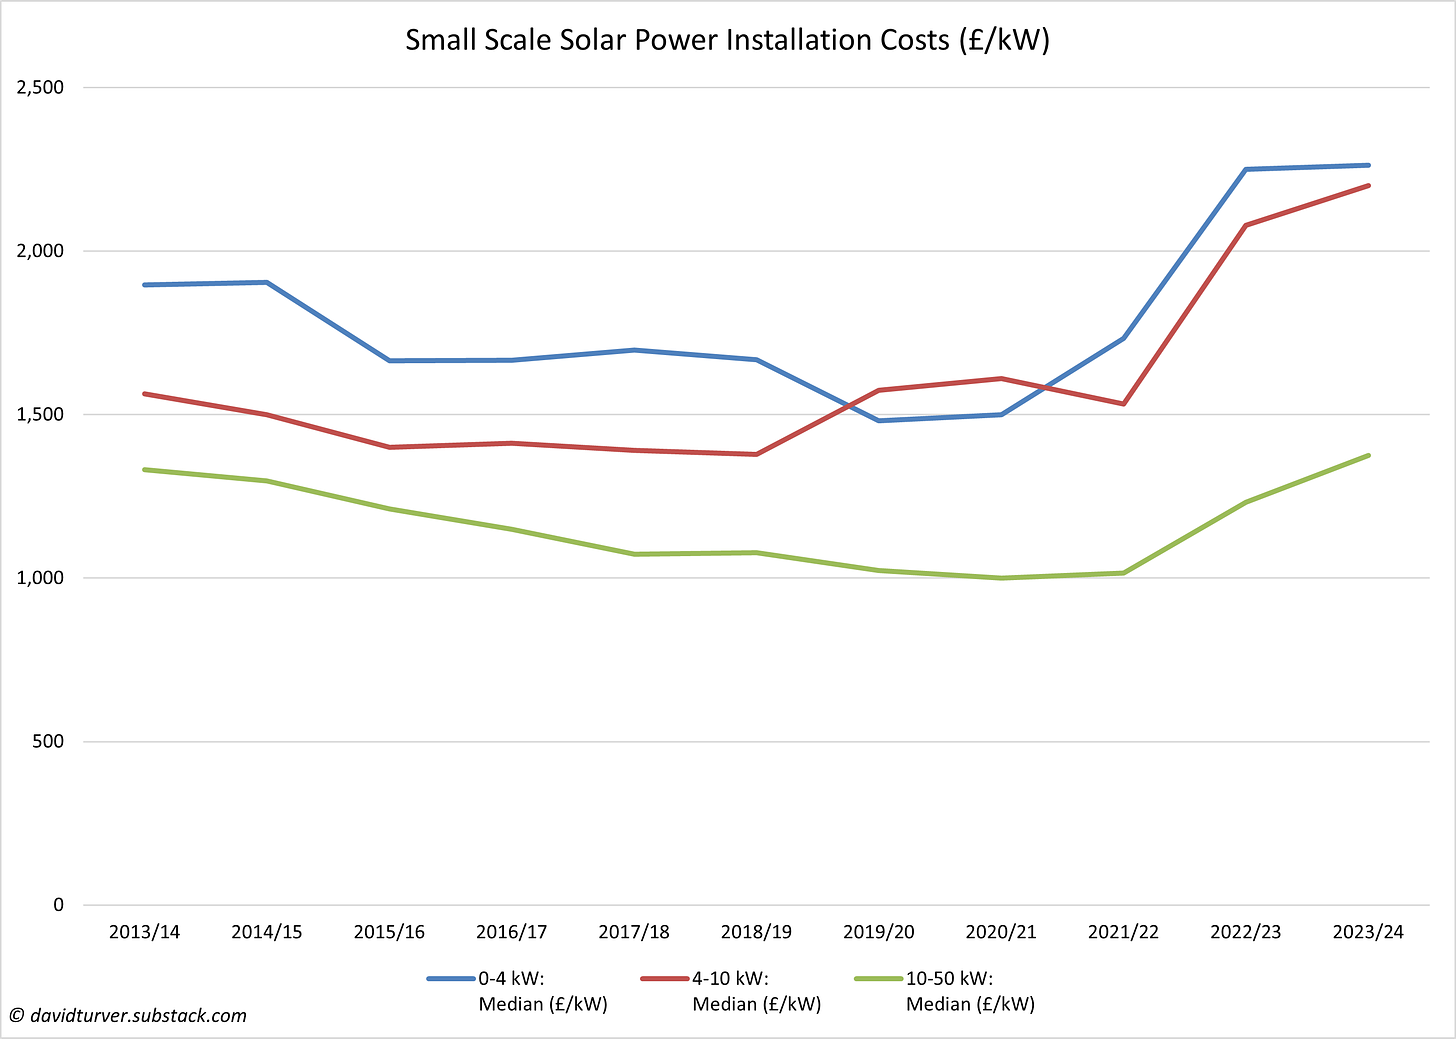
The gap between the Government model and the strike price they are offering is getting wider and wider. Moreover, recent Government figures show that the installation cost of small-scale solar is rising too and is now above where it was a decade ago in nominal terms, see Figure 6.
With costs rising and market value falling below zero as the penetration of solar power increases, it cannot be long before the exponential curve starts to slow down, particularly in temperate latitudes like Northern Europe.
Two of the Economist’s solutions to the low value problem involve spending even more money, either by building bigger interconnectors across European states or by installing batteries or other storage. But these “solutions” would only add to the cost of solar power for no increase in output, although the market value might rise a bit.
The Impact of Silver on Solar PV Costs
We also need to look at where solar panel costs might be going, and to do that we need to consider the silver intensity of solar power. The durability and conductivity of silver makes it an essential ingredient in solar panels. Even though the amount of silver required per Watt of capacity has fallen over the years, the increase in solar panel production has led to ever higher overall demand for silver in photovoltaics.
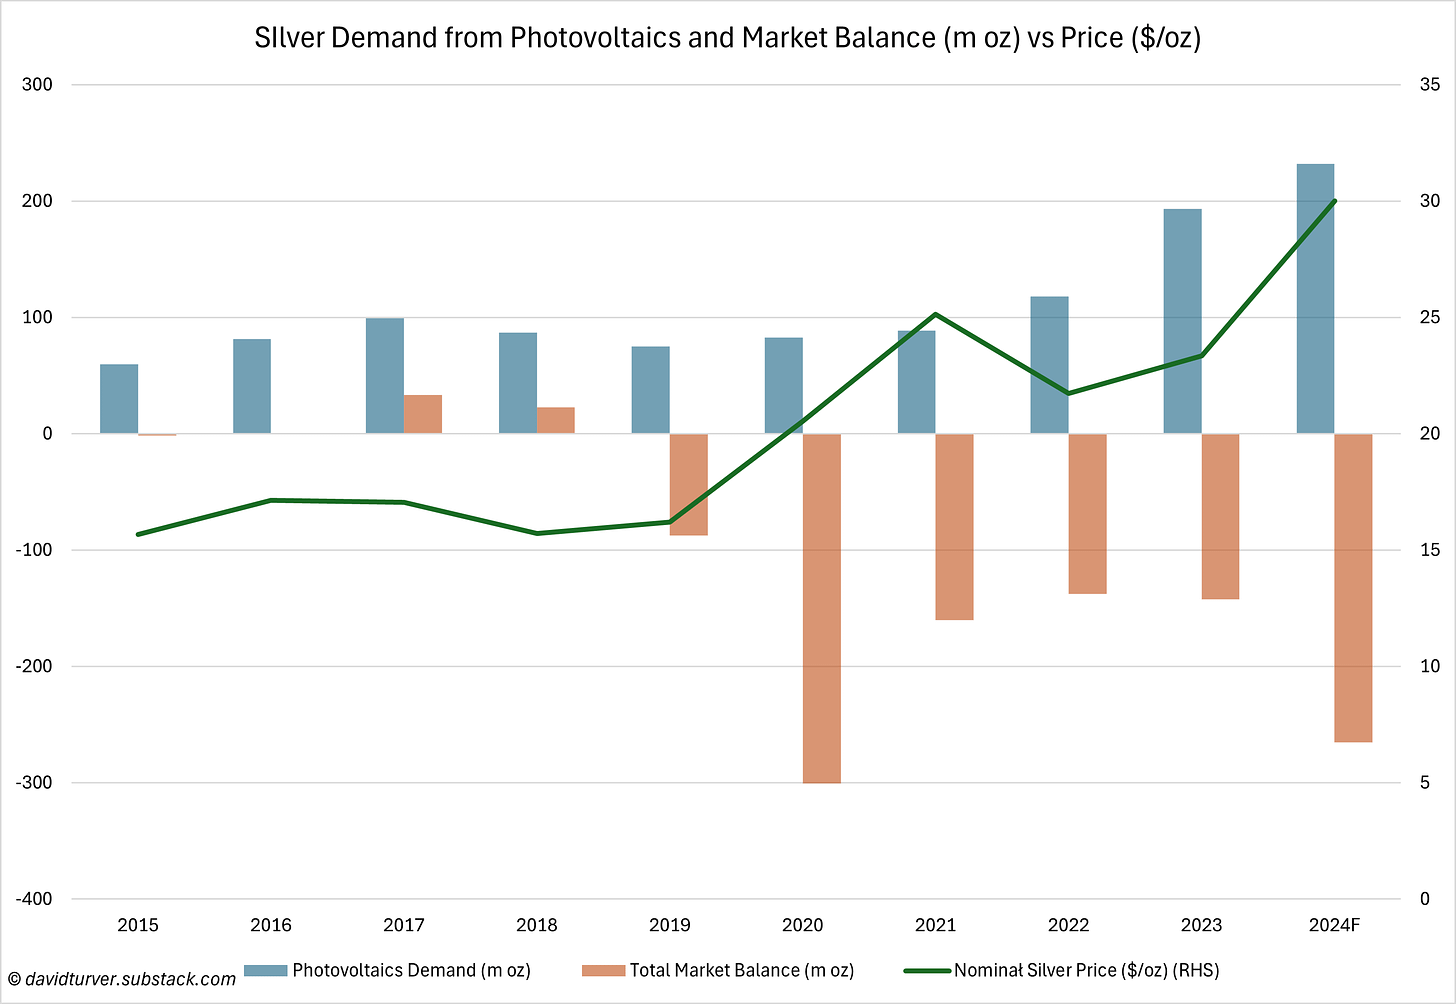
The rapid increase in solar panel production and silver demand is having an impact on the price of silver. The Silver Institute produces a silver supply and demand table, an extract of which has been converted into chart form in Figure 7 below.
The blue bars show the relentless increase in photovoltaic demand for silver, especially since 2019. Photovoltaics consumed over 19% of all silver supply in 2023. The orange bars show the total market balance and demonstrate the overall silver market has been in deficit since 2019. In 2023, the deficit was about 14% of total supply and the annual deficit is forecast to widen in 2024. This has led to silver prices almost doubling from $16 per troy ounce (toz) in 2019 to around $30 per toz today. The Silver Institute also shows that overall supply from mines and recycling has remained stable at around 1bn oz per year while demand is forecast at over 1.2bn oz this year.
According to the VDMA (the German Engineering Foundation), in their Photovoltaic Technology Roadmap (p21) a typical PERC type solar panel contains about 9.6mg of silver per Watt of capacity. A typical 400W panel therefore contains about 3.8g of silver or 0.12 toz. In 2023, with silver costing just over $23 per toz, this silver would have cost about $2.89 per panel or about 5% of total panel costs assuming $0.15 per Watt of capacity.
However, the solar panel market is moving towards TOPCon technology which uses about 15mg of silver per Watt, so a typical 400W TOPCon panel uses 6g of silver and at today’s price of around $30 per toz this works out at $5.80 per panel or about 10% of panel costs.
Future Demand for Silver from Solar Power
The same VDMA report shows on p21 that they expect the amount of silver required per Watt of capacity will fall over the next 10 years for each of the main technology types. However, on p38 they also show how the market share of the different technologies will change and there is a marked shift towards TOPCon and SHJ technologies which both use more silver than existing PERC technology.
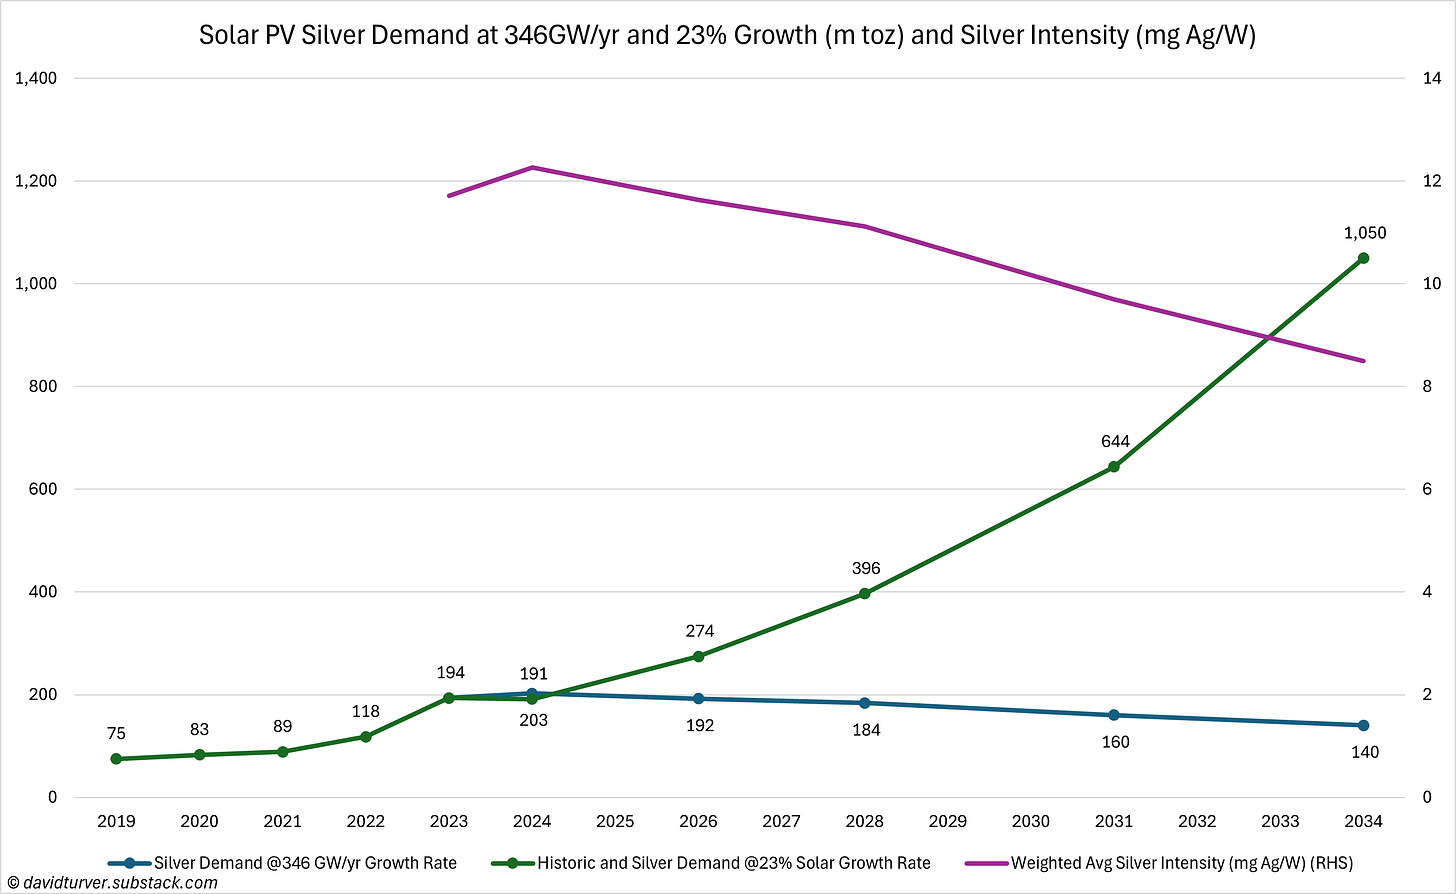
By combining the data from both VDMA tables, we can calculate the weighted average silver intensity by year. This rises a little in 2024 to 12.3 mg Ag/W before falling gently to 8.5 mg Ag/W by 2034. We can use these silver intensity figures to calculate the impact on silver demand for different growth rates of solar power. The result is shown in Figure 8.
The blue line shows that if the rate of new installations remains flat at around 346GW per annum, then annual demand for silver will fall over time. This reflects an overall decline in silver intensity as technology improvements outweigh the change in panel type mix. However, this rate of new additions would still lead to an ongoing silver supply deficit which is bound to lead to a price response at some point. We must remember though that the Economist’s prediction was for solar power to increase exponentially. The green line shows silver demand from solar power from 2019 and how demand will increase from 2023 if solar PV expands at 23% per annum. As we can see, silver demand grows from 194m toz in 2023 to 1,050m toz in 2034. This is more than 100% of 2023 silver supply from mines and recycling. Think about that for a moment, if solar maintains its average growth rate of 23% per annum, then by 2034 it will be consuming all of the global silver supply.
The price of silver is notoriously volatile, for instance it rose more than five-fold from a trough around $9 in 2008 to a peak of nearly $50 in 2011. Moreover, when the Hunt Brothers tried to corner the silver market, the price rose 10-fold from around $5 in early 1978 to $50 in January 1980.
We can only speculate on what might happen to the silver price if demand from solar PV rises from 193m toz in 2023 to 274m toz in 2026 or over 1bn toz in 2034 with the market already in structural deficit. However, the price will likely rise to many times higher than the current around $30/toz. This could mean that just a few grams of silver per panel could push up the cost of solar panels considerably, thus curbing demand for solar panels.
Conclusions
Making predictions of continued exponential growth are always fraught with danger. Once numbers get to a certain size, the compounding effects of growth rapidly become very large indeed.
The impact of producing more and more electricity of zero value will mean that solar power destroys its own economics, particularly in temperate zones like Europe. The only thing that could save it is continuing generous subsidies awarded by virtue-signalling politicians. Remember, the new Labour Government’s plan is to triple solar by 2030, creating more occasions when its output has no value. However, supply-side constraints in the silver market will likely push up the cost of solar panels, making them much less attractive, even in the tropics. The odds are that the Economist is still an excellent contrarian indicator, and its exponential growth predictions will likely come unstuck in a few years.
David Turver writes the Eigen Values Substack page, where this article first appeared.


To join in with the discussion please make a donation to The Daily Sceptic.
Profanity and abuse will be removed and may lead to a permanent ban.
First they came for the anti-lockdown protesters, and I did not speak out – because I was not a lockdown protester…
Then they came for the unvaccinated, and I did not speak out – because I was vaccinated…
Then they came for booster refuseniks, and I did not speak out – because I was a booster shot taker…
Then they came for me – and there was no one left to speak for me.
SOUTHWEST CAVES! Cancels Plan to Put Unvaxxed on Unpaid Leave!!!
https://www.youtube.com/watch?v=P4EV_dOFGA8
https://s.w.org/images/core/emoji/13.1.0/svg/1f388.svgFriday 22nd October 11am https://s.w.org/images/core/emoji/13.1.0/svg/1f388.svg
Yellow Boards Event – Stand by the Road
Tesco Superstore
17 County Ln, Warfield, Bracknell RG42 3JP
https://s.w.org/images/core/emoji/13.1.0/svg/1f388.svgSaturday 30th October 2pm https://s.w.org/images/core/emoji/13.1.0/svg/1f388.svg
SPECIAL STAND IN THE PARK WINDSOR with Yellow Boards
Alexander Park (near Bandstand) Stand in the Park
Barry Rd/Goswell Rd
Windsor SL4 1QY
Meet in the Park 2pm followed by walk to
Stand in the Town Centre By the Castle
About 2 hours in total.
https://s.w.org/images/core/emoji/13.1.0/svg/2764.svg Stand in the Park https://s.w.org/images/core/emoji/13.1.0/svg/2764.svgMake friends – keep sane – talk freedom and have a laugh
Wokingham Stand in the Park Howard Palmer Gardens RG40 2HD Sundays 10am
behind the Cockpit Path car park in the centre of the town
Telegram http://t.me/astandintheparkbracknell
I met this lady outside Parliament yesterday. She is only the side of good. We all know who is only the side of evil
SOUTHWEST CAVES! Cancels Plan to Put Unvaxxed on Unpaid Leave!!!
https://www.youtube.com/watch?v=P4EV_dOFGA8
Friday 22nd October 11am
Yellow Boards Event – Stand by the Road
Tesco Superstore
17 County Ln, Warfield, Bracknell RG42 3JP
Saturday 30th October 2pm
SPECIAL STAND IN THE PARK WINDSOR with Yellow Boards
Alexander Park (near Bandstand) Stand in the Park
Barry Rd/Goswell Rd
Windsor SL4 1QY
Meet in the Park 2pm followed by walk to
Stand in the Town Centre By the Castle
About 2 hours in total.
Stand in the Park
Make friends – keep sane – talk freedom and have a laugh
Wokingham Stand in the Park Howard Palmer Gardens RG40 2HD Sundays 10am
behind the Cockpit Path car park in the centre of the town
Telegram http://t.me/astandintheparkbracknell
Good cause.
Help someone who stands firm.
Pledge made.
“Evil triumphs when good men and women do nothing”.
She is one of a number of selfless heros who deserve our praise and support.
Who’s the quote by?
It’s a popular misquote, probably an adaptstion of this from Edmund Burke.
“When bad men combine, the good must associate; else they will fall, one by one, an unpitied sacrifice in a contemptible struggle.”
It makes a good point though. If we do nothing, evil will prevail.
Looks fake as fuck!
Debbie Hicks is 33 in numerology. Could be a freemason.
Absolutely.
There’s no way at least three police officers would be involved in arresting her when there’s so much violent crime happening, and the idea that British Bobbies would wear masks to hide their identities is laughable.
Only three rozzers!? Your British cops aren’t trying hard enough. See Victoria’s finest showing how it should be done. And there’s plenty more where that came from in the Victorian franchise of the Little Covid Shop of Lockdown Horrors
She should have glued herself to the M25.
Glad to see DS making a contribution to this
Out of interest. How did she keep getting arrested at protests, was she pushing herself forward or was she being targeted?
These controversial crowd funding things need an anonymous way to contribute. At some point in the future they will grab all the data and hunt us down. I’d suggest using Bitcoin and not requiring identifying details. That should make it a lot harder to come after people.
If they win, they’ll be hunting us down, anyway.
Done!
Keep up the great work folks.
Also, let’s all boycott any and every event or venue that demands the NHS app or a test result.
Why is it Lawyers never do anything for free?
I have to say I didn’t agree with her hospital filming stunt.
To be fair, some do. (Not many)
At least 2 Hypocrites liked her stunt. You claim its an intrusion & discrimination if some asks your excuse for not wearing a mask, but think nothing of abusing sick people’s privacy wondering around hospitals with a camera.
She literally filmed herself braking the law, then published the evidence on social media. Save your money, she’s got no defence & no chance.
Looks like the 77th can’t find people who can spell.
Clearly we are becoming a police state. She is heading for a show trial.
I’d like to learn more about her “crime” of filming an empty hospital ward.
I thought about going to my local hospital in the first lockdowns and trying to do the same thing, but I didn’t have the guts. She did.
Many of these hospitals were as empty as they have ever been in the fist six or so months of the lockdowns.
Even today, it would be interesting to see who is really being treated, what ages and what medial conditions they are being treated for.
It’s quite convenient that the hospitals have been off limits to journalists or citizen journalists for almost all of this pandemic.
The hospitals that we have all paid tax for over the years so should be entitled to walk round at any time.
Pledge made.
Pledge made. The amount pledged has doubled today, thanks DS for raising this.