The media recently reported on the results of a study of Danish sperm donors from 2017 to 2022 which showed ‘sluggish sperm’ and attributed this development to the effect of lockdowns. In reality, the study showed a very significant 30%-plus decrease in motile sperm concentration and there is every reason to imagine that both lockdowns and vaccination are to blame.
The fact that this topic was even vaguely reported is surprising given that the mainstream media have been studiously ignoring the well documented negative effects of vaccination on sperm since the end of 2021. I first highlighted these problems years ago using data from a November 2021 paper published in Wiley Andrology and authored by a group of Israeli scientists, Itai Gat et al. The paper was fascinating, not only for its stunning findings, but also because this paper had enormous viewing figures and was widely reported by the ‘conspiracy theorists’ on social media. The huge reach meant that every media science editor must have been aware of the findings and all of the major outlets ignored the findings, with the Epoch Times being one of the only outlets to cover this (see my 2022 video on the media blackout).
This new June 2024 paper was written by Professor Allan Pacey from the School of Medical Sciences, University of Manchester and others. They looked at the key metrics of sperm supplied by two groups of donors, the first group who had applied to Cryos International in Denmark and the second group who had been accepted as donors. Cryos International is a sperm bank business operating at four sites in Denmark.
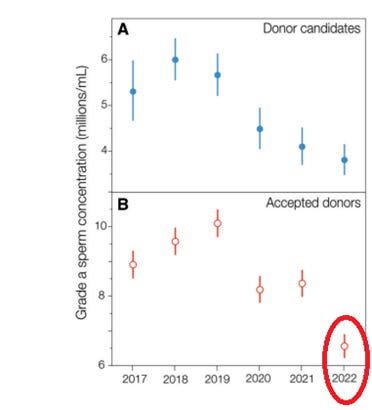
The researchers looked at several indicators including sperm volume (mL), sperm concentration (million per mL) and sperm count (millions). Broadly speaking those main indicators were stable over the period from 2017 to 2022 – so far so good. The real problem came when looking at the motility of the sperm samples, that is the degree to which they move around. There are two main grades of motility; grade a (progress>25µm/s) and grade b (progress >5 µm/s and <25 µm/s) and the two grades added together produce the total motile sperm count (TMSC) and motile concentrations. The scientists found very significant declines in these metrics for both donor candidates and accepted donors.
Unsurprisingly, the accepted donors tend to have better sperm performance metrics than the candidate group. The chart below shows the concentration of highly motile grade a sperm for both donor candidates (A) and accepted donors (B); there is an obvious and significant decline between 2019 and 2022 for both groups. For the donor candidates (blue) the decline was a whopping 30% over three years. The paper doesn’t provide this figure for the accepted donors (red) which have an overall higher grade a concentration, but the drop appears to be even more significant at over 40% (circle).
The scientists were only able to account for around 3% of the observed changes based on impacts from known external factors such as changes in the weather. They don’t venture too many theories on the reasons behind the unexplained 97% variation other than to say that Covid “is an unlikely explanation for our observations”. For many other health problems in the post-Covid era, it has been difficult to split the impact of reduced access to healthcare from other factors. In this case reduced access to healthcare can probably be excluded so the observed decline will be due to a combination of lockdown and vaccines only. The authors of the paper are careful not to even mention the possibility of vaccine involvement but stick instead to changes triggered by lockdowns, including changed levels of physical activity and diet.
The impact of lockdowns would certainly be consistent with the significant decline between 2019 and 2020, but are likely less relevant to the further significant decline between 2021 and 2022 when restrictions were largely lifted. The failure to even mention the possible impact of vaccinations is bizarre given the fact that Israeli researchers had already identified a very similar reduction in motile sperm count post-vaccination. They identified a whopping 22% reduction in the total motile count post second dose vaccine (75-125 days after second dose), which partially recovered to a 19.4% reduction, 145 days or more after the second dose.
Does it even matter?
Context is very important here given that many Western countries are facing a demographic winter, with domestic populations dropping as deaths are becoming consistently higher than births. The raging argument about immigration barely mentions the demographic context, which is driving many of the huge demographic shifts we are seeing (see here and here).
Scotland monitors monthly births by occurrence and you can see a very long downward trend. There is an obvious lockdown related impact which shows up as very low births around January 2021, and it is difficult to see a clear vaccine related impact here. But the main point is that within the context of a long downward trend anything that further reduces male or female fertility would have serious demographic consequences.

Take the win
It is of course positive that the mainstream media are finally reporting the enormous negative consequences of Covid policies, albeit years too late to do any good. For me there is an open question as to why no mention was made of the jaw-dropping Israeli findings in 2021, 2022 or 2023. Similarly, it is hard to understand how the researchers in the current June 2024 paper managed to not even mention the word vaccine given the existence of compelling evidence from the Israeli study. Is self-censorship at play here? In any event, on the positive side awareness is spreading and people reading the Thinking Coalition’s social media posts or watching our videos will have been aware of these red flags years ago.
I will be doing some more work on demographics in the near future.
Alex Kriel is by training a physicist and was an early critic of the Imperial Covid model. He is a founder of the Thinking Coalition, which comprises a group of citizens who are concerned about Government overreach. This article was first published on the Thinking Coalition’s Substack. Subscribe here.


To join in with the discussion please make a donation to The Daily Sceptic.
Profanity and abuse will be removed and may lead to a permanent ban.
UK Column interview with James Roguski about the WHO. Was not so much about Sovereignty as we were lead to believe, more about ‘equity’, and public private partnerships. They want you sick, and want easy access nano particles fairly distributed in African countries. Good interview.
https://www.ukcolumn.org/video/hey-ho-the-who-has-got-to-go-with-james-roguski
It would be really interesting to see the findings of research based on vaccinated vs. unvaccinated. However, I’d be very surprised if any funding were forthcoming for something that challenged the pro-vaccine orthodoxy so overtly.
Well, the first problem is that they’ve done all they can do not keep those records.
Recall that they kept track of vax versus umvaxed right up to the point where they could no longer manipulate the data to show the benefits of jabs because the evidence to the contrary became so strong. And then at that point they decided to stop keeping records and focused instead on covering their tracks
Pfizer was way ahead of the game making sure their control group got jabbed 6 months after the trials. They knew from the start they’d need to cover their tracks.
Lockdowns? Bloody lockdowns? Again??🤯😤
To my mind this is clearly the fault of the Jewish feminists. I mean, duh.🕵🏽♀️
Oops, I meant Zionists. My bad.😳 The devil’s in the details.👀
Declining sperms counts are not a new thing. It’s been happening for some time.
I’ve heard all sorts of things attributed to it. Plastics, pollution, estrogen in the water from contraceptive pills.
I have my own theory. I call it the zoo effect. There are certain animals that just don’t reproduce as well in captivity as they do in the wild.
Humans are an increasingly domesticated species in modern society. A minority engage in physical labour. We are so focused now on safety that even small tiny risks are being eliminated. We have no real sense of danger. At least no physical one. Ever expanding state welfare slowly saps any sense of having to fight to survive.
Our lives are closer than they have ever been in the history of humanity to the cushy protected predictable environment of a zoo. And if humans are anything like many animals that come from the wild the zoo environment is a killer for the reproductive instincts..
And in that context, with the threat of food shortages, we’re in for a shock. Where is the Bear Grills videos!
Grilled bear steaks?
What about a radically different theory? A phenomenon we don’t understand was observed in a vanishingly small number of random people from Denmark. This means something we don’t understand was caused by something we don’t know. Or, in other words, that our knowledge about this world is seriously limited. Maybe, we should think a bit more humbly about ourselves and our ability to change the world according to some masterplan, say, Save the planet from the effects of climate change! Or maybe, we should think a lot less favorable about people proposing panaceas, whatever they are.
The article is about sperm motility not declining sperm counts, but in any case decreased motility is not something new.
The testes are outside the body cavity because spermatogenesis occurs best at below core body temperature.
Tight fitting underpants/trousers and sitting down for long periods, central heating, raises the temperature of the testes affecting sperm production and motility.
This has been recognised for quite some time.
This question has been bothering me for a few days now – do we, I mean our side, really know ALL that is going on with the mRNA junk? From my perspective I think it was Dr MikeYeadon who properly alerted me to the fact that the so-called “vaccines” had clearly been brewed to maim, sterilise and kill and numerous studies have since confirmed this but, the Davos Deviants are not in any way backing down and are determined to have another go. The intention is to ensure that everyone on the planet gets jabbed.
Why? We know already how dangerous this junk is and they know we will not touch it yet they carry on.
Is there another ‘ingredient’ in the mRNA brews that is not yet activated, that our side has not detected? Might it be the case that malnourishment, as an example, will kick-off some other turbo disease(s)?
Perhaps I am overthinking things but as I stated above this has been bugging me for a few days now.
Anyway…
Campbell delves into some of the detail here: https://www.youtube.com/watch?v=tFzTTuuzfH0 . In the first few minutes he describes that the technique could be quite flexible, in addition to the built in risks for individuals. A cynic might say that it is a flawed idea, except in special circumstances in which the risk versus benefit sums justify the risk. But they don’t talk about that.
Thanks John.👍
And this one https://www.youtube.com/watch?v=nq2qwql8xBs , published today.
https://www.youtube.com/watch?v=nq2qwql8xBs
And just watched this.
Blindingly obvious that what matters is getting the mRNA into bodies. The excuse, the ‘disease’ is irrelevant. All that matters is the mRNA. I am satisfied something more sinister is being hidden within the mRNA junk. Time will tell.
Thank you once again for the links 👍
I have just viewed this first link and I agree with Dr Campbell – very disturbing. The intention then is to get mRNA in to as many people as possible. The particular “vaccine” type is irrelevant, all that matters is getting mRNA into everybody.
My suspicions have been confirmed.
Asian/Black uptake of the jab was I believe reported to be far below White people. Can’t blame them not trusting the white mans’ medicine.
It has been well documented for some time that exposure to radiofrequency electromagnetic radiation (RF-EMR) decreases sperm counts and motility as well as increases oxidative stress.
Effects of the exposure to mobile phones on male reproduction: a review of the literature – PubMed (nih.gov)
Effect of mobile telephones on sperm quality: A systematic review and meta-analysis – ScienceDirect
Accumulated data clearly shows a relationship with RF-EMR exposure and fertility issues in general, however, there’s an alarming lack of exposure data in today’s vastly different ubiquitous digital environment (3, 4 and 5g (6g???), Smart meters/appliances, wireless headphones, mast/antenna coverage/proximity/densification, powerlines etc).
Indeed, another high-level study conducted by international experts found evidence linking breast and brain tumours, male reproduction outcomes and neurodevelopmental disorders. Thus, with regard to claims of ‘there’s no evidence of harm etc…’ there is little evidence i.e its safety remains unproven. This, added to the mRNA medicinal products now hitting the markets, we have potentially a catastrophically toxic combination.
https://www.globalresearch.ca/dr-clare-craig-covid-vaccines-unsafe/5859892
Dr Clare Craig gives evidence to the Peoples Vaccine Enquiry yesterday. Is that our own Will Jones taking part in the proceedings?
I would think it is obvious because it is in accordance with everything else. Low energy, low morale, a night on the town just becomes a drag. We have to go through these periods and we have to accept them stoically. You can’t take cosmic rays and the eternal clockwork for granted and assume that today will be like tomorrow.
If you don’t tune in to the super-sensible world then everything that is happening now will just seem nauseating like a statagem devised to fill you with despair and end your life. It cannot be done that is the real lesson of our age.
If you really want to develop your balls then look at Taoist alchemy. The point is the effort of holding the seed and if you can hold the seed for nine years then you woull develop a massive reservoir of chi. Chi is something that we laugh about. We say that you can masturbate as much as you want and it won’t harm anything. This is entirely incorrect. If you are a masturbator then don’t worry about what you did in the past. Just stop now. You might worry about strong urges byt after three weeks the energy starts to retreat backwards and energize the human body. The Australians have it right when they talk about a man being full of spunk.
Bear in mind that a philosophy called gradualism has unconsciously infected our thinking. The idea that time moves forward not with sudden catstrophes but essentially like a process of rock erosion. In a sense this is the biggest deception. You don’t even have to go that far back or that far afield to see that European history was hit with cataclysm after cataclysm for two thousands years, in terms of records. The idea of constant stability is itself a ruse to keep you as a cog in the system. If we knew that that it would hit the fan tomorrow would we even bother turning up for work, maybe we would ask deeper questions and obviously they don’t want that.
There is no going back to fertilising a woman. Even if your balls are intact your circumstances won’t allow it. That is because they literally have you by the balls. The point being the destruction of the entity that has you by the balls.
If you have a young man in your family then send himn to a sperm centre. It is a matter of urgency that all virile young men of our type attend coaching sessions.
We need to start having large families again. Just find yourself a lovely voluptuous cum-bucket wife and inseminate her as much as possible and bring the littleuns into the world. We need to celebrate the titties and vagina and penis.
The sperm in our local mens toilet is very active. It manages to climb up the walls and everywhere.