
The Christmas classic by Frank Sinatra tells us that the weather outside if frightful. The United Nations Office for Disaster Reduction (UNDRR) tells us the same thing and uses a chart showing the incidence of natural disasters to underpin its assertions. Frank Sinatra’s statement may have been true, but the UNDRR’s version is not true and is in my view designed to mislead.
The nature of the statistical fraud being used was first exposed by a group of Italian scientists led by Gianluca Alimonti and Luigi Mariani who concluded that “on the basis of observational data, the climate crisis that, according to many sources, we are experiencing today, is not evident yet”. Their original paper of November 2021 was retracted under a highly politicised process, but they issued a related paper which was accepted in July 2023. Their basic insight was that looking for a trend in the total number of weather events recorded over a long period cannot generate meaningful results as the phenomenal increase in recording technology and population growth would inevitably increase the number of recorded events. They showed that when you started splitting recorded weather events into different categories of severity then there was no meaningful increase in the number of severe events over time. Their logic was that the recording capacity of severe weather events was more or less constant over time and if there were genuine trends then they should be noticeable in severe weather events.
The chart that UNDRR refers to shows the incidence of natural disasters by year for events recorded in the EM-DAT database, maintained by the Centre for Research on Epidemiology of Disasters (CRED). The chart below shows the number of natural disasters per year taken from EM-DAT:
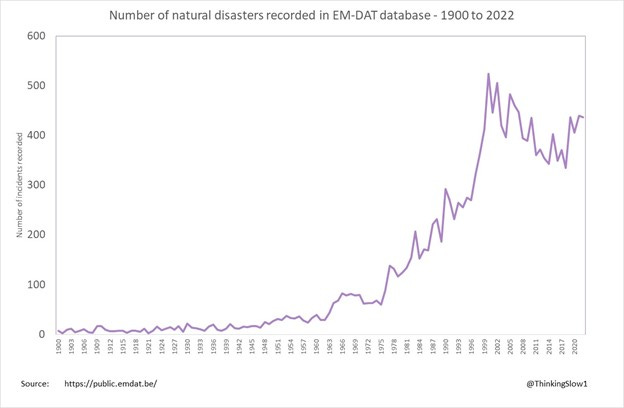
Wow! On the face of it this looks pretty bad and the UNDRR report goes on to extrapolate out the trend from 1970 in order to predict a rapidly increasing number of disasters going forward.
The criteria for inclusion in the EM-DAT time series are as follows:
- 10 or more deaths
- 100 or more people affected/injured/homeless
- Declaration of a state of emergency and/or appeal for international assistance
Looking at the total number of incidents recorded ignores the severity of the disasters over time. I have broken down the total number into categories based on the number of fatalities, which is very similar to the approach used by Alimonti and Mariani:
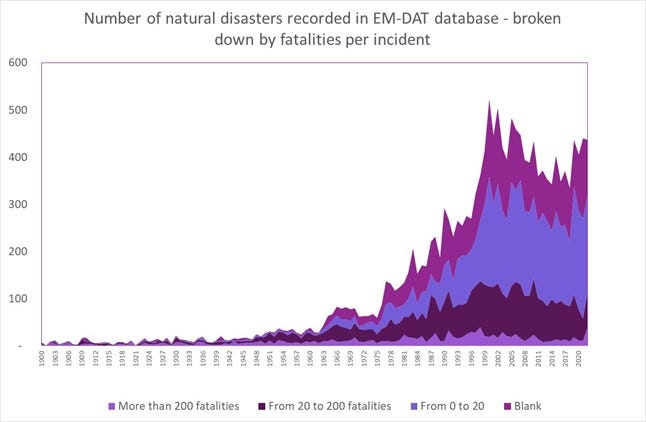
It is to be expected that the number of severe incidents is much lower than less severe incidents. The key question is the trend line for severe incidents. From this chart you could see that the incidence of major natural disasters with more than 200 fatalities has thankfully remained largely stable since as far back as almost 1900 with a flat trendline (light purple at the bottom). Also you should notice that a very significant part of the increase in natural disasters has come from events where there were no fatalities recorded (blank), or for disasters with 20 or fewer fatalities (light blue). The Italian paper looked at trends in significant natural disasters and found no trend. It also looked at a number of other categories of climate events in the original paper including droughts and hurricanes and found the same overall pattern: an increase in total incidence but completely flat for severe events over long periods.
The capacity to recorded natural disasters has obviously grown since 1900, particularly with the advent of a large number of satellites from the 1970s onwards. In fact, the compilers of the database make this very clear: “In the meantime, communication technologies have improved, with the first personal computers and satellites appearing in the 1970s and the advent of the World Wide Web in the 1990s. Technologies and initiatives can be considered responsible for the dominant trend observed.”
This hugely important caveat is ignored by the UNDRR, which is why I would claim that its intention was to deceive, since there is no way that its researchers and officials were unaware of this caveat when including their chart in the Our World at Risk report.
Another key fact that UNDRR ignores is that the total loss of life from natural disasters has rapidly decreased from levels seen in the early 20th century. In fact, the average annual loss of life in 2020 to 2023 is at the lowest level recorded since 1900.
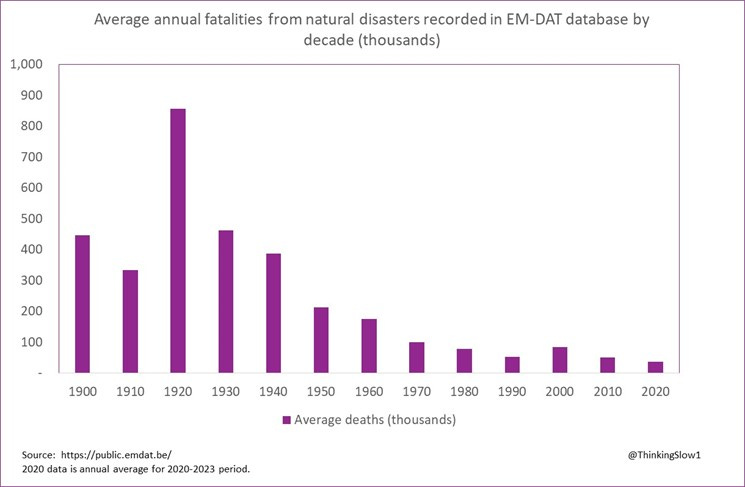
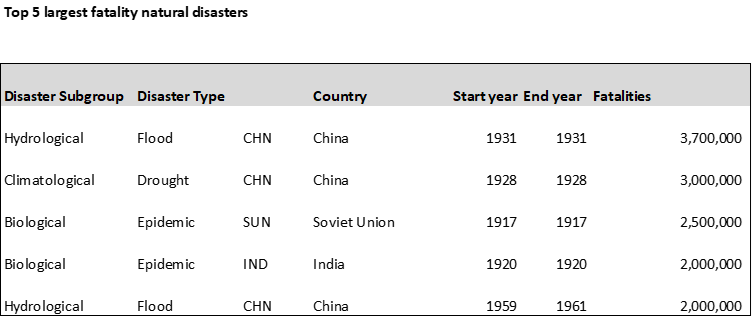
This result is skewed by some massive loss of life in the early part of the 20th century, particularly with huge loss of life in China and India recorded in EM-DAT.
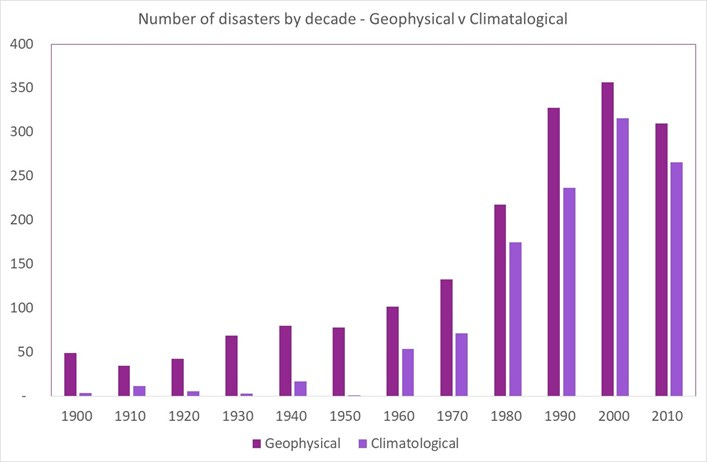
The Italians also noticed that the increase in geophysical disasters is almost the same as for climatological disasters. The category of geophysical disasters covers: earthquakes, mass movements (dry) and volcanic activity. There is no credible way to claim that climate change could have a meaningful impact on the number of geophysical disasters so any increase would have to be for other reasons; the drivers of those events must surely be different. The fact that these different categories of natural disasters develop in exactly the same way again suggests that increased measurement capacity is driving the increase in both cases.
It is important to remember that these time series refer to incidence of climate disasters, as distinct from climate related readings such as temperature, rainfall etc. The key conclusion then is that although there has been an increase in many (but not all) climate metrics, there has been a simultaneous reduction in the total number of deaths from climate disasters. This indicates that adaptation is a more sensible approach than trying to actually change the climate. This is a theme explored in Bjorn Lomborg’s excellent book False Alarm. Lomborg’s conclusions are very similar to those reached in the revised Italian paper, specifically (per Lomborg): “The science shows us that fears of climate change apocalypse are unfounded. Global warming is real, but it is not the end of the world. It is a manageable problem.”
Summary
In my view UNDRR is using dirty tricks to extrapolate a time series from 1970 and claiming a ‘climate emergency’ when the compilers of the data make it clear that the underlying trend primarily reflects the enormous increase in measuring technology. The U.N. appears to be fuelling the disaster rhetoric, which by happy coincidence will likely be used to justify an increase in its own budget and powers, as well as being a justification to crush individual liberties through centralised carbon budgets.
My own view is that the totalitarian-style government being created by the climate alarmists is far more dangerous than a change in the weather.
Alex Kriel is by training a physicist and was an early critic of the Imperial Covid model. He is a founder of the Thinking Coalition, which comprises a group of citizens who are concerned about Government overreach. This article was first published on the Thinking Coalition website. Sign up for updates here.


To join in with the discussion please make a donation to The Daily Sceptic.
Profanity and abuse will be removed and may lead to a permanent ban.
OFF-T. Dan Wotton Uncensored. I swear he did a video on Farage on his new YT channel, now it is gone. Censorship in action!
Youtube are part of the elite. Google, one of he most dangerous companies on the planet.
Strangers in the UN, exchanging glances
Wondering how to screw us, what are the chances
We’ll afford our bills, before the year is through
Something in their plan, was so inviting
Something in the lies was so enticing
Something in my gut, told me it just ain’t true.
Strangers in the night,
Sad frozen people, we are strangers in the night
Up to the moment when we opened up our bill
We can feel the chill.
Hate was just a glance away and warmth will never come our way and
Ever since that day they passed Net Zero
Got to save the planet to be the hero’s
How did it come to this for Strangers in the night
Sorry Mr Sinatra
We need a Dean Martin next.
When the Bills hit the sky, like a big Pizza pie
That’s not Amore.
I asked Chat GPT to translate this article into song lyrics in the style of Frank Sinatra’s version of “Mack the Knife”. It was too long to post, but try it… Left me thinking AI’s not all bad!
Darin’s was the best.
Yes I have done this in a few articles.I think I used “The Flintstones” one time, and ofcourse it is just a bit of fun to try and inject humour into an issue which is not funny in the least but as the article says if you are going to tell the truth make people laugh. Sometimes laughing at people and their silly ideas and activism is more effective than arguing with them. People don’t like being laughed at.
You are poet, and you don’t know it.
History Debunked talks about this including the Cricket match cancelled in June 1975 because of snow. A few people were talking about this yesterday.
https://www.youtube.com/watch?v=4S7F6bqkTCE
Has the frequency or intensity of extreme weather increased? ———-eh NO. So why are being told the opposite? Who is it that tells you the opposite of what is true? –LIARS.
I’m hoping we are close a moment similar to this one in the Wizard of Oz, only perhaps it won’t be so cheary?
https://www.youtube.com/watch?v=-RQxD4Ff7dY
The Wizard of Oz | 75th Anniversary “Wizard Revealed”
If TPTB can make 2+2=5, then its considerably easier to make you believe in an illusion. And especially when nearly all forms of modern communication are created for and censored by the Grand Illusionist.
10 comments only? ———-C’mon guys. This is the most important issue for prosperity for every person in this country and all over the western world. The climate charlatans are fleecing us big style and we are letting them away with it.
They are crucifying us with sky high energy bills under false pretences, and that then pushes up every single thing up up up in price as it all needs electricity to make.
Where is the Investigative Journalism like this on Mainstream News? Why do BBC never ask questions like this or present these reports? Because they are part of the eco socialist stitch up.————-I warn you all now. Wait till the “dynamic pricing” starts via your smart meter and if you thought it is bad now for high prices, you ain’t seen nuthin yet.
If you want to get your blood boiling look for BBC More or Less for today’s date. They were attacking Reform on Agenda 2030 and excess deaths claiming it is not worse than 2020 when only a few months ago they changed how deaths were calculated and talked about it in that very show.
BBC More or Less ——OK
The more you collect and measure, the more you find. Sounds a bit like the Covid saga. As a corollary the more you publish, the more people look critically at it and the more fault is found.
Good point. I have thought that myself in the past as well. ——-A good example is football scores. Let’s say you start taking a note of all football scores today. In a years time you will see lots of 0-0 1-0 0-1 2-1 2-2 3-2 3-3 etc etc etc. But as you continue to note scores you will see more scores like 3-5, 7-3 5-5 etc creeping in there. This might give the impression that scores are getting more extreme. But in reality you are only really starting to see things that have always been happening before you started recording them.
The UN? Totally to be trusted.
https://www.youtube.com/watch?v=B7vReIN-shs&t=9s
Gaza War Day 222: IDF drone footage shows Hamas gunmen inside UNRWA logistics centre in Rafah