
It feels as if global warming campaigners are breaking open the champagne and raising a toast to record temperatures, together with that wagging finger: “I told you so!” BBC News has reported that global temperatures breached the 1.5°C threshold for the first time between February 2023 and January 2024. That is to say, average global temperatures were 1.5°C higher in that 12 months than they were in the 1850-1900 period, according to the EU Copernicus Climate Change Service (C3S). This followed an earlier EU C3S claim of 1.48°C for the calendar year 2023.
We have indeed seen some record temperatures in Europe in the last couple of years. On January 25th, a temperature of 30.7°C was reported at Calles in Spain. And in the U.K., a record maximum value of 40.3°C was measured at Coningsby on July 19th 2022. It’s possible that this peak reading was affected by aircraft movements – as discussed in the Daily Sceptic – but the hourly reported value of 39.6°C at 1400 and 1500 UTC, in a moderate southeasterly wind, was almost a degree above the previous U.K. maximum (38.7°C on July 25th 2019 in Cambridge Botanic Garden). These appear to be real records above the long-term values. But we ought to ask: what might have caused such high values, alongside the claimed record global temperatures in 2022 and 2023? A small part of the rise may be due to the urban heat island effect, or changes to instruments or screens, but that is far from the whole story. Upon closer inspection, much of this additional atmospheric heat is due to changes to oceanic sea surface temperatures (SST), which then warms the lower atmosphere. BBC News shows a rise to 21.05°C in global SST by February 3rd 2024.
El Niño
One major factor is the onset of a strong El Niño event, although this only had an impact in late 2023 as the Pacific Ocean warmed. The Oceanic Niño Index (ONI) rose to 1.6 in the Autumn (August to October 2023) and was 1.9 by the end of the year (October to December). Previous occasions when the ONI has gone above 1.5 in the last 70 years are the events in 2015-16, 2009-10, 1997-98, 1991-92, 1987, 1982-83, 1972-73 and 1965. The later events correspond with spikes in the satellite temperature data of the global lower atmosphere. El Niño events normally last 12 to 18 months – the strongest events occurred in 2015-16 and 1997-98, which peaked at 2.4 and 2.6 respectively.
Atlantic Multidecadal Oscillation
A longer trend in the ocean temperature is the Atlantic Multidecadal Oscillation (AMO), with sea surface temperatures varying by a degree or so over many years (as measured between the equator and 70°N). The AMO is itself coupled with changes in the troposphere and stratosphere, while the stratospheric wind regime may also be affected by changes in solar activity. A declining AMO trend in the 1960s and 1970s led to fears of the return of an Ice Age, but with an increase in the 1990s and 2000s there was a recovery in northern hemisphere temperatures. The AMO index has been positive since that time and it varies by about a degree and a half (°C) over these long periods.
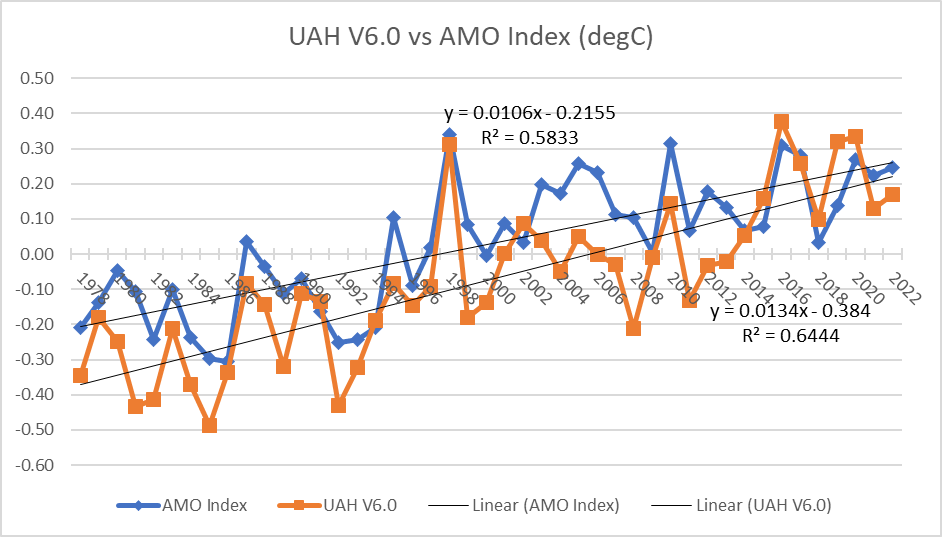
It is interesting to compare the AMO index with the UAH V6.0 satellite temperature dataset, which began in 1979, while the AMO index has been reconstructed back to the mid-19th century. The satellite data of the lower atmosphere have the benefit of overcoming changes to such things as the urban heat island effect. When the two datasets are plotted alongside each other, from 1979 to 2022, they show a close correlation – in fact, the trend line is close to one-to-one (see chart below). Of course, correlation doesn’t equal causation, and one would not expect a change in the North Atlantic sea surface temperature to have an equally measurable change upon the global atmospheric temperatures. The close correlation may be due to the way the index is constructed. However, it is not unreasonable to expect that there would be some physical connection between the Atlantic sea surface temperature and the temperature of the lower troposphere, particularly in Europe, which may partly explain the record high European temperatures of recent years.
Cleaner air
Since 2000, good progress has been made in cleaning the global atmosphere of industrial pollutants, first in North America and Europe, but increasingly in Asia. Pollutants include particulate matter, sulphur dioxide and nitrates. Using NASA satellite data, the estimated climatic influence of this pollution is thought to have reduced the global temperature by 0.5°C, while removing the pollution may have brought forward the time when it is forecast to rise 1.5°C above the pre-industrial levels. Pollutants have a direct effect in modulating the amount of energy that enters and leaves the Earth’s system, but there is also a secondary effect through physical changes to clouds. Atmospheric pollutants act as cloud condensation nuclei. So, more numerous particles and sulphur aerosols in the lower atmosphere lead to an increase in the number of cloud droplets, but they are smaller in size. Overall, the cloud liquid water content rises in the presence of such pollution. This makes clouds more reflective to incoming solar energy.
Further regulation that came into force in 2020 through the International Maritime Organisation (IMO) has also led to a decrease in the amount of sulphur that can be released from a ship’s exhaust – down to 0.5% from 3.5%. Overall, with a cleaner atmosphere and less reflection from clouds, there is likely to be a corresponding rise in the amount of solar radiation absorbed in the oceans; hence the ocean temperature may rise. This may partly explain the rise in global ocean sea surface temperature, which feeds into a rise in the lower troposphere temperatures.
Hunga Tonga – Hunga Ha’apai
On January 15th 2022, a massive volcanic eruption in the Pacific Ocean sent a plume of ash, water vapour and other gases into the atmosphere, reaching as high as 55 km – that is through the stratosphere and into mesosphere. It is estimated that 146 mega-tonnes of water vapour were added to the thin stratospheric atmosphere as a result. Pressure shock waves were observed around the world and measured on barometers at ground level. When sulphur dioxide is pumped into the stratosphere it can cool the planet, as occurred with Pinatubo from 1992, but such an excessive amount of water vapour released so high may trap additional heat below. One paper, published in Nature Climate Change, suggested that this could lead to a temporary warming of surface temperatures to 1.5°C above the long-term average within the following decade.
Summary
Many politicians, climate scientists and the mainstream media are pushing the world towards Net Zero carbon emissions because of rises in greenhouse gases and global temperatures. But, as has been widely noted, this is a policy goal that does not fully consider the economic impact upon ordinary people. Closer inspection of recent changes to the global atmosphere and ocean sea surface temperatures suggests that increased greenhouse gases is only one factor in the recent rise in temperatures. Natural variability in terms of the short-lived El Niño event, the longer-term rise in the AMO index, a move towards cleaner air and less pollution, and volcanic activity from the Hunga Tonga – Hunga Ha’apai volcano may all have had a significant impact upon recent rises in global temperatures. Consequently, the long-term climate sensitivity to increases in greenhouse gas emissions, which is somewhat uncertain, may in fact still be at the lower end of expectations, as argued for by Lewis and Curry for example. If that is so, then the rush to meet Net Zero targets is misguided.
Andrew Sibley is a semi-retired Chartered Meteorologist with an MSc in Environmental Decision-Making and an MPhil in Theology.


To join in with the discussion please make a donation to The Daily Sceptic.
Profanity and abuse will be removed and may lead to a permanent ban.
There is not a shred of real world evidence that CO2 has its ‘evil’ hand on the planet’s thermostatic control knob.
But even if there was, Volcanic activity, particularly from the thousands of undersea volcanos we haven’t even discovered, makes human CO2 emissions look like a bat fart in a gale.
It’s almost not worth refuting the details anymore because this has nothing to do with the climate or the environment and everything to do with a 60 years in the making political control agenda designed and nurtured by a bourgeois cult of sociopathic grifters.
https://www.youtube.com/watch?app=desktop&v=5mK-FMY1374
The agenda.
What are “global temperatures”? How are they measured? What has been the “global temperature” since the birth of this planet?
There are no ‘global temperatures’ not only does the requisite planet-wide surface network of measurement instruments not exist, there is no temperature for the globe.
What is presented as ‘global temperature’ is not a temperature at all, it is a number, an anomaly between a baseline average of temperatures of the 1980s and an average cobbled together from a few temperature stations covering only a small area, mostly Europe and the US and elsewhere in cities, large towns or airports.
If the anomaly is above the baseline = global warming 😱. Despite the actual input temperatures being accurate only to within +/- 1C, output anomaly runs to two decimal places, making the output more accurate than the input (!) and therefore global warming is created within the data manipulation and bears no relation to reality.
The truth is nobody knows the rate of global warming because it cannot be observed and measured which means it is so slow and so small, it isn’t visible.
That is why the Global Mean Temperature Anomaly junk science is used as it is the only way the ‘scientists’ can contrive to show global warming.
But the joke is, since the late 90s it has shown a flatline, then slight decline, which is why global warming is now climate change.
Indeed. The whole idea seems like nonsense.
correct
A very good question that I have always asked climate alarmists and as yet have never received an answer. ——-You are probably aware that the earth does not have a temperature. There are an infinite number of temperatures on earth. Temperature is a field. ———But alarmists will say they are talking about “global average temperature”. But some things lose their meaning when you average them and temperature is one of those things, mainly because temperature is not an amount of anything. It is just a condition. —————–But in any case we have not had thermometers all over the globe recording temperatures. They were mainly in wealthy western countries so the coverage historically was sparse. —–Maybe the climate change dreamers think that we just stick a thermometer under the earths armpit and take a reading.
Now you’ve started a discussion on the location of the World’s armpit!
Yes, it just makes no sense to me. Even if you could produce an average based on thermometers every few metres across the whole planet I’m not sure it would mean much – there might be some specific area that got really hot, and everywhere else was the same. How would you use the information, and how would you decide what was related to human activity without understanding what influences temperatures, and having historical data going back to the start of time. Baffling how anyone can claim they understand this stuff and keep a straight face.
If we take a reading in Brisbane and another in Iceland and calculate some average of the two. We will get a number. —-But that number is NOT a temperature. It is simply a statistic. It is NOT the temperature of anything.
But some things lose their meaning when you average them and temperature is one of those things, mainly because temperature is not an amount of anything. It is just a condition
I have a spare minute so maybe worth going round this again.
The mean July temperature in Casablanca is 22 degrees – is that meaningless? (tourists and tourist agencies seem to think it means something)
Pretty much. It means that the sum of all July temperatures measured somewhere in Casablanca was 682 and there are many ways such a result could have been achieved, eg, 30 days of -1⁰C followed by a single day of 712⁰C because someone activated a WWII-era incendiary bomb at a suitable distance.
I don’t think I used the word “meaningless”. ——But you are talking about the average temperature over time in one place (Casablanca). I could easily have a thermometer on my garage and take readings all year and I might be able to calculate some average. But the Earth is NOT one place. Global temperature is a different thing entirely. But when it comes to climate it is NOT Global Average Temperature that is used. It is Temperature Anomaly. This compares individual years to the so called average of 30 year periods. But if you compared to some other 30 year period your result would be very different.
Correct, Varmint.
People are anyway easily bamboozled by “records”, even where a number is only a miniscule amount greater than the previous (and probably fiddled) previous “record”.
Very frequently we are instructed that some random measurement or thing is “Unprecedented!”
A bit of examination usually reveals that this latest marvel is recorded somewhere new, with records there of only a few years, or only since satellite data was available, or at best, since 1900. Something “new” after just 124 years may be a curiosity, but it is a crap reason for promoting hugely expensive and unreliable Ruinable Energy, for example. Especially as trivially warmer and trivially more of a trace gas beneficial to all life on Earth are both a GOOD thing.
I don’t think I used the word “meaningless”.
You just wrote “lose their meaning” – a subtle distinction to say the least!
Why it is meaningful to average over time but not over space?
All that using a global temperature anomaly does is change the base of the temperature measurements – no difference in theory to using Kelvin instead of Centigrade. You can use any base including the average of any period you want. It makes no difference to the temperature change which is what climatologists are concerned with.
Anyhow – if you are right I think you had better explain to all those scientists, alarmist and sceptical alike, that measure global average temperature anomalies in different ways, that they have been wasting their time all these years and you have discovered there is a schoolboy error in their thinking.
Because averaging is still a mathematical algorithm to eliminated the amount of random error in different measurements of the same quantity. Which means the Casablance average is also completely meaningless because the July temperature in Casablanca doesn’t exist. Only different temperatures measured at different times. Calculating it nevertheless is a typical example of But can’t you see it’s a number which came out of a computer! Surely, this must mean something! In this case, it means that somebody with no clue about the purpose of the algorithm clicked on a certain button in his spreadsheet application.
Because averaging is still a mathematical algorithm to eliminated the amount of random error in different measurements of the same quantity.
Estimating a true value from many measurements is one use of the “mean” (there are other types of average of course). But it is far from the only one. For example, given a few common assumptions about the variability in weather, the average temperature in Casablanca in July suggests I can leave the heavy coat behind. As you say there is no actual July temperature we are trying to estimate but it is still useful to have a single number that summarises past temperatures. The difference in the average height of adult men since 1600 suggests something fundamental has changed in the environment or the genetics of the population (and of course you can do a statistical test to see if the difference in means is statistically significant). Again there is no true height of the population we are trying to estimate. And so on …
Average temperature in Casablanca suggests this only because you know that it’s not a RAF base in Spitzbergen with occasional bouts of abnormally high temperature. But that’s just an aside. The main point is mathematical properties of the algorithm. When there are n numbers, the mean is computed by adding them all together and dividing the result by the number of numbers which were added. As it stands, that’s just a formula and that it’s useful for something needs to demonstrated. Assuming these n number are measurements of the same quantity each with some unknown amount of measurment error in it, adding them together will tend to cause the random parts of this error to cancel each other out provided enough numbers are added as random errors will equally likely be too much or too little, ie, positive or negative. The result of the calculation is thus likely a bettter approximation of the quantity than each of the individual measurments because some noise has been removed from it. But you know this yourself and in any case, I written the same text as a reply to one of your other Dustcloud! comments in the past.
A much better way to represent a range of temperaturs would still be a frequency distribution because this would show outliers clearly as outliers instead of just integrating them into the same number.
I don’t understand why you included the description of the mean as an estimate of the real value given a set of measurements. I accepted that this was one use of the mean. My point is there are many, many others. I provided two. You addressed one of them.
The frequency distribution would indeed be even better for telling me what to wear in Casablanca in July and using the mean does require some assumptions about the distribution of temperatures but the mean is some use and much more succinct than a frequency distribution.
You simply didn’t address comparing the means of two populations which is after all the basis of vast quantities of hypothesis testing. In fact this is, sort of, the logic behind global temperature averages. By comparing the mean now with the mean in the past we can decide whether there has been a statistically significant change (of course it is more complicated than that but it is the fundamental principle).
But alarmists will say they are talking about “global average temperature”.
Only if it suits them. The reason for discarding the medieval and Roman warm periods is usually given as only local phenomina. However, a historic local warm period somewhere would have increased global average temperature in exactly the same way heat records on measured on RAF bases also do.
Has it been a warm one, though? Not in the UK. We’ve had a particularly cold summer. When talking about the Medieval and Roman warm periods, the cultists always like to say “that was localised, not global”, but their global temperature claims don’t need to be subjected to the same discrimination, apparently.
As for what actually made it warmer, I’d say urbanisation. A lot of these “record breaking” weather stations are on airports. Next to hot, black tarmac and jet exhaust. Weather stations that used to be in the middle of a field somewhere 20 years ago are now being surrounded by new development. And as anyone knows, cities are 1.5-2 degrees warmer than the countryside.
It’s all a doomsday cult designed to fool the intellectually lazy.
Excellent comment.
We were short of solar input in the Summer last year, and from a gardening/farming perspective, we had a cool Spring up front, which affected the timing and yield of many things.
In the US about 50% of their weather stations no longer report actual measured weather. In their place computer generated values are added to the dataset. Their “warming” is based on an algorithm that is tweaked to produce the desired result. Tony Heller has posted multiple videos on YouTube on how past and present data has been altered to change a cooling trend to a warming trend.
Weren’t algorithms invented by Al Gore just after he invented the internet?
You’re thinking of Al Gore rhythms.
It’s a pity that the author didn’t mention more about the influence of the multi billion ton nuclear explosion at the centre of the Solar System. The Sun provides the vast majority of the Earth’s energy input and will therefore have the ‘casting vote’ on regular cycles of global temperatures. The Milankovitch cycle is just one of these.
Also it would be nice if the author could help kill the CO2 myth once and for all. According Planck’s law, CO2 cannot keep anymore atmospheric heat in than it is already doing now. According to Prof William Happer even doubling the CO2 concentration would barely be noticeable on the temperature dial, yet it would greatly increase plant growth and drought resistance as well. A complete win win. This is backed up by empirical satellite observations.
https://www.youtube.com/watch?v=v2nhssPW77I
The whole CO2 agenda is a total scam. It provides the excuse for authorities to control every aspect of our lives.
Water vapour is incidentally a far larger greenhouse gas, but there is no obvious mechanism for the authorities to weaponise this against us. So they default to CO2.
And that increase from 380ppm to 420ppm since the end of last century purported to be from fossil fuel emissions, has resulted in revegetation of a huge area of former desert and semi-arid land equivalent to the area of tte USA. (According to NASA satellite images.) more CO2 means plants need much less water.
Less visible plant growth increase must have happened elsewhere too, and grain crop yields have soared.
Why would people who cry buckets about loss of habitat and demand rewilding want to reduce CO2 and destroy all that plant and animal life?
Funny lot, the Climatrons. Barking mad I think.
They are not so mad as you think. ——-They know that it isn’t about the climate. The climate is just the excuse for the Sustainable Development Politics.
Sun spot activity correlates regarding temperature on earth very closely. CO2 does not.
Solar activity has been declining for decades, as you might expect with a complex thermonuclear reactor that has many cyclical processes where the drivers of these interact in a complex manner.
Solar maximum for cycle 25 seems to have been in June/July 2023, and there is a grand solar minimum approaching in the next 15-40 years, less marked than the Maunder minimum in the 17th century but it will definitely be noticeable. Cycle 26 may be really weak, already the last 2 cycles have been the weakest in more than a century. The positions of the outer planets have an effect on the solar system’s barycentre and that is a very significant modulator of the solar dynamo that leads to the magnetic effects of the 11 year and 22 year cycles.
If you put 100,000 highly sensitive temperature sensors all around the globe and cherry pick the highest readings, then compare that to perhaps a couple of dozen tree ring samples and ice cores (margin of error on those???) it’s not exactly hard to claim a minuscule 1.5c warming effect.
Especially when you throw out half of the tree ring dataset you used because it doesn’t show warming in the present era, and you combine it with a different dataset that does, just so you can produce a graph resembling a hockey stick…
And then win a court case using a very biased judge and jury.
It seems reasonable to suppose that variations in Atlantic sea surface temperature are linked to surface air temperature, especially given the behaviour of the jet stream. After all, look at the local temperatures early this month in the South West in the UK. A fair bit above the long term average, during a period where a lot of the wind came from the mid latitude area.
Ironic that reduced pollution can result in increased solar energy; the Net Zero cult don’t advertise that.
https://www.conservativewoman.co.uk/depopulation-the-elephant-in-the-eco-room/
A worthwhile exploration of the Malthusian thinking behind The Club of Rome’s ‘Limits to Growth’ and subsequent extensions of the depopulation agenda.
wink
https://www.conservativewoman.co.uk/migrant-rent-deals-reveal-the-hollowness-of-goves-housing-pledges/
Michael Gove doing a Govey with his usual sleight of hand behind the housing crisis.
He is going to offer gold wrapped five year deals to landlords who offer rentals to immigrants but fine them and imprison them if they rent to illegals.
He’s a kidder is Govey. 😀😀
Those who choose to holiday in warmer parts will report that temperatures are constantly in the mid to high 30s and that life proceeds as normal. Elderly people are witnessed walking about unaided, without distress.
What is the problem?
The bit I like best is unquestioningly temperatures rises caused by reducing so-called pollution. It’s said that pollution must be reduced because otherwise, it’ll kill us. But temperatures rises are also supposed to kill us. In inappropriately simplified terms, the Khant of London is fabricating temperatures rises by prohibing car travel in order to tell people that car travel must be prohibited because it causes temperature rises. An absolutely delightful contortion. If we weren’t supposed to believe that it made sense.
Climate change science ——–A smidgeon of the truth elevated into a planetary emergency for political purposes with no evidence whatsoever. ——–And they are getting away with it. The unsuspecting public better get suspicious pretty soon before their freedoms and prosperity are GONE.
So what if it got or gets warmer or colder?
Humans have nothing to do with either.
Fighting windmills, at best. https://www.theepochtimes.com/article/fixation-on-co2-ignores-real-driver-of-temperature-say-experts-5588495?utm_source=partner&utm_campaign=ZeroHedge&src_src=partner&src_cmp=ZeroHedge
If the author’s graph had gone up to the present time it would show that the UAH global average tropospheric temperature (published monthly by custodian Roy Spencer) has undergone a sudden huge spike of almost 1°C in less than a year. Such rapid spikes can only be the result of natural forces, typically El Nino events and certainly not man-made CO2 which alleged only forces global warming at a slow but steady rate of about 0.2°C per decade.
The current El Nino has been fairly modest and is already waning. The reference to the slow-acting 60-year cycle AMO is a red herring. There can be no doubt that the global warming of 2023 was the result of the Hunga Tonga undersea volcanic eruption which spewed massive quantities of water vapour, the most powerful greenhouse gas, into the stratosphere.
Meteorological authorities around the world have lied by omission in suppressing information on the Hunga Tonga event so that they could blame the elevated temperatures on man-made CO2 at their COP28 pantomime. They are doubly embarrassed because Hunga has shown that water vapour is a much more potent global warming agent that CO2.
What of the ‘unexpected’ methane bursts from Nordstream and other more recent pipeline sabotage – if there needs to be mass culling of cows because their farts are adding to global warming, surely these events should be considered too?
The ‘vegan’ food industry doesn’t sell plant-based alternatives to natural gas.
Anything within a 5 000 year time span is weather.
The climate establishment of government funded data adjusters are not reliable witnesses. If we were in a court of law their testimony should therefore be ignored. The manipulation of climate data to suit a particular narrative renders these people not only a disgrace to their profession (as Mark Steyns book was called) but actually means they should be charged with contempt of court. ————-The temperature record of earth has been fiddled about with more than a prostitute’s knickers.