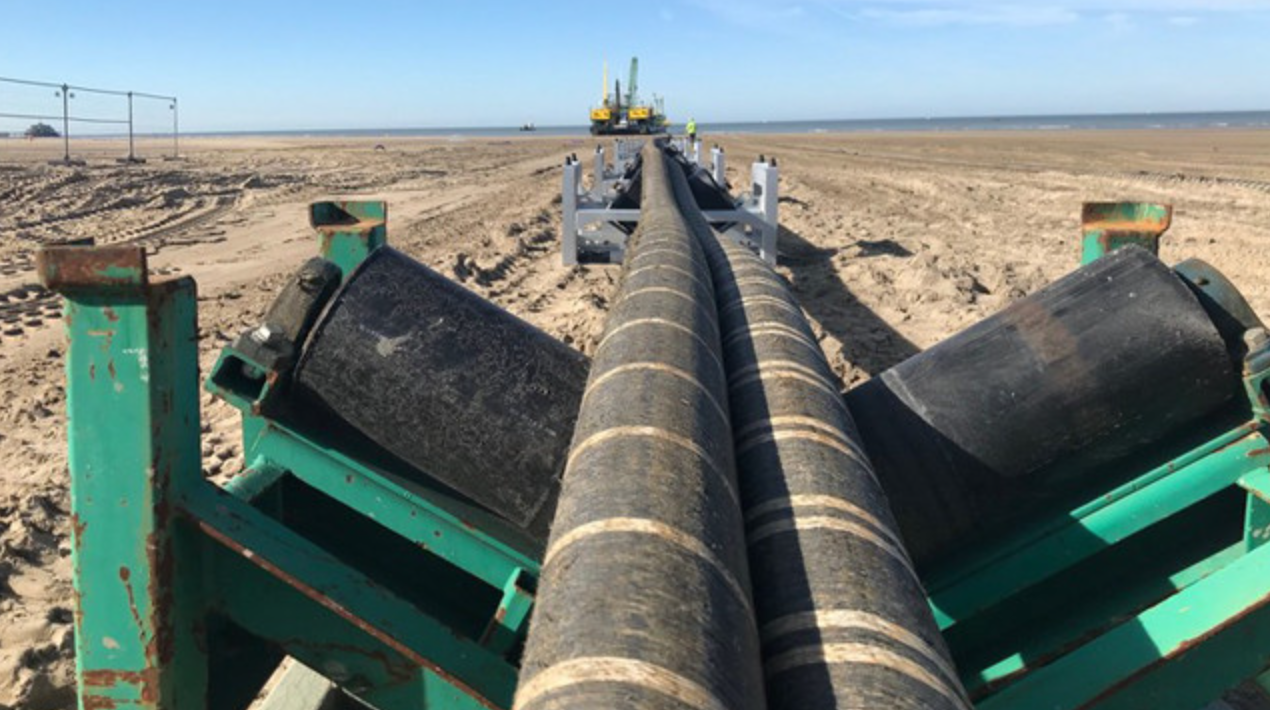
The U.K.’s electricity supply is becoming increasingly reliant upon a series of umbilical cables to the continent called interconnectors. We have cables stretching to France, Belgium and other countries. Last month, a new £1.7bn 475-mile interconnector to Denmark was brought into operation.
Energy Secretary Claire Coutinho was lauding this new development on X. She said (emphasis mine):
The 475-mile cable is the longest land and subsea electricity cable in the world and will provide cleaner, cheaper more secure energy to power up to 2.5 million homes in the U.K.
It will help British families save £500 million on their bills over the next decade, while cutting emissions.
A deep dive into the National Grid interconnector data, however, shows the claims of cleaner, cheaper and more secure energy do not stand up to scrutiny.
They do not make it cleaner. The problem here is that the energy we import during periods of high demand is likely to be ‘dirty’ energy from diesel engines and coal-fired power stations, while the energy we export in times of lower demand is more likely to be ‘clean’ energy from wind and solar.
Second, it is crystal clear that interconnectors do not provide cheaper energy. In fact, quite the opposite is true. The data show that interconnectors have helped us to perfect the art of buying high and selling low. The price we pay for imports is consistently above the market price and the price we get for exports is significantly below market rates; we even frequently pay others to take surplus power off our hands (known as negative prices). In what world does it make economic sense for consumers to pay elevated subsidies to generate wind and solar power, and then pay people overseas to take the same power off our hands?
The security claim is more nuanced. In a narrow sense, the interconnectors do provide some security, because even though at times we pay excessive prices for electricity, the interconnectors have allowed us to keep the lights on. However, we are in this position because people like Alok Sharma gleefully blew up coal-fired power stations, so destroying our domestic dispatchable capacity. This means we are now dependent upon the kindness of strangers in Europe to keep the lights on. As other European countries continue down the path to Net Zero, destroying dispatchable sources (like Germany’s nuclear power plants) and installing more intermittent sources of energy, we may not be able to rely upon this kindness. Indeed, it is likely that Europe-wide electricity surpluses and deficits will synchronise as a result of seasonal and time-of-day related factors, meaning that there will be more times when we pay others to take our surplus power and we will pay extremely high prices more frequently when demand is high and renewables generation is low. Overall, this is clearly not a position of security, it is a position of weakness and insecurity.
Moreover, it is also clear from the data that we are a price-taker, not a price-maker in the market. This is because we do not have sufficient dispatchable capacity to meet demand. Again, this is a position of insecurity, not strength.
The detailed analysis below demonstrates clearly that Coutinho’s claims are bogus.
Volume and Value of Electricity Traded Over U.K. Interconnectors
Figure 1 shows the volume of electricity traded over the interconnectors by quarter for the years 2021-2023.
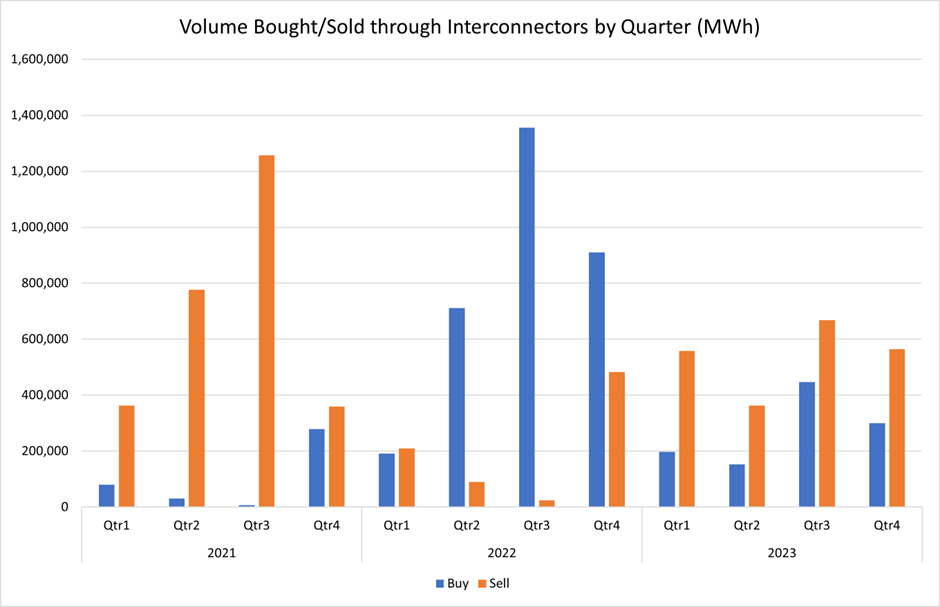
In 2021, we sold far more electricity (2,756 GWh) than we bought (396 GWh) over the interconnectors. In 2022, the position reversed, and we bought (3,168 GWh), which is far more than we sold (805 GWh). In 2023 the situation was more balanced, and we sold more than twice as much (2,152 GWh) as we bought (1,097 GWh). It appears that the third quarter of each year always sees the most total trade.
Figure 2 shows the value of electricity traded in the same periods. The total value of the trades is calculated by multiplying the volume traded in each auction by the volume weighted price. As we shall see below, sometimes we pay people on the continent to take power away, making the price is negative for some sales transactions. When the data are aggregated, this has the impact of reducing the apparent sales value.
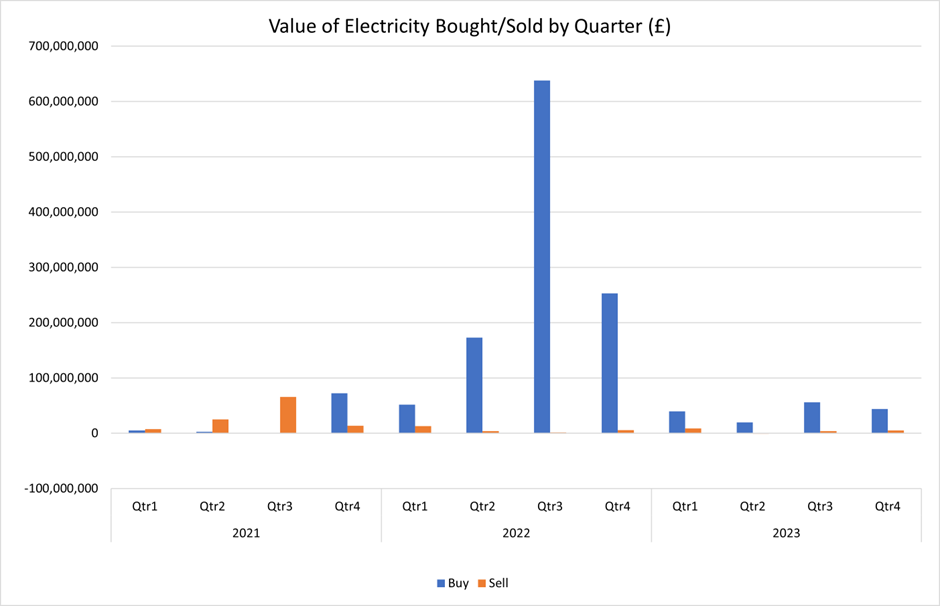
In 2021, even though we sold far more electricity than we bought, the value of the trade was more even with £112m of sales and £82m of purchases. 2022 was an exceptional year with £1,116m of purchases and only £25.2m of sales. In 2023, even though the volume sold was double the volume we bought, perhaps surprisingly there was a much higher value of purchases (£160m) than sales (£16.7m).
Electricity Interconnector Transaction Prices Compared to Daily Market Prices
Figure 3 compares the average price of purchases and sales through the interconnectors to the market price of electricity on the day of the transaction. The Low Carbon Capture Company publishes a dataset that shows the subsidies paid in relation to various renewables through CfDs (contracts for differences) each day. That dataset also includes the Market Reference Price for wind and solar on each day which has been used as the market price for each day. Typically, this reference price is set by gas-fired electricity.
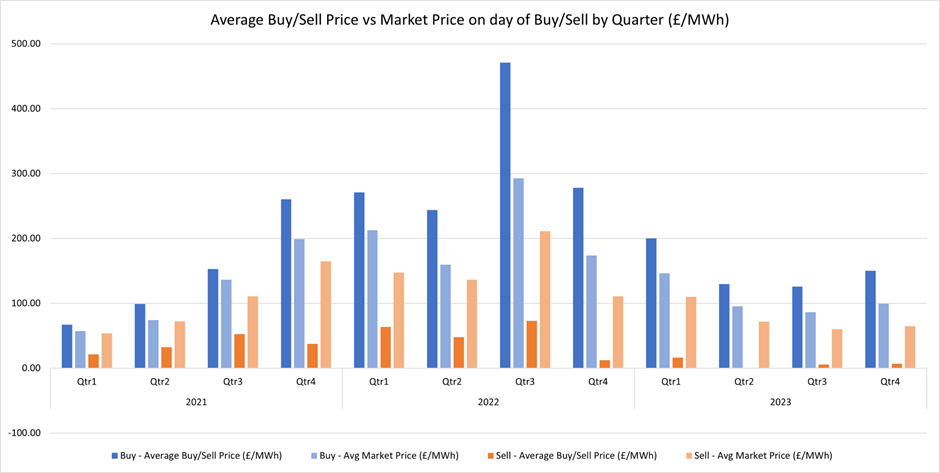
The dark blue bars show the average buy-price in the quarter. The light blue bars show the average of the market prices on the day of the transactions. The dark orange bars show the average sell-price in the quarter and the light orange bars the average of the market prices on the day of the transactions.
The bottom line is that we typically pay more than the market price for buys (the dark blue lines are taller than the light blue lines) and accept less than market price for sells (the dark orange lines are shorter than the light orange lines). Looking at the detailed data, the maximum purchase price was £6,599.98 per MWh on July 20th 2022 when the reference price was £247.91 per MWh. The minimum sale price was £–404.71 per MWh on May 29th 2023 when the reference price was £63 per MWh. It is also interesting to note that for the whole of the second quarter of 2023, the average sale price was slightly negative (£–0.22 per MWh). These negative sales prices mean we paid others to take this electricity off our hands.
Frequency Distribution of Electricity Interconnector Buys and Sells
Figure 4 shows the frequency distribution of buy and sell prices for 2023.
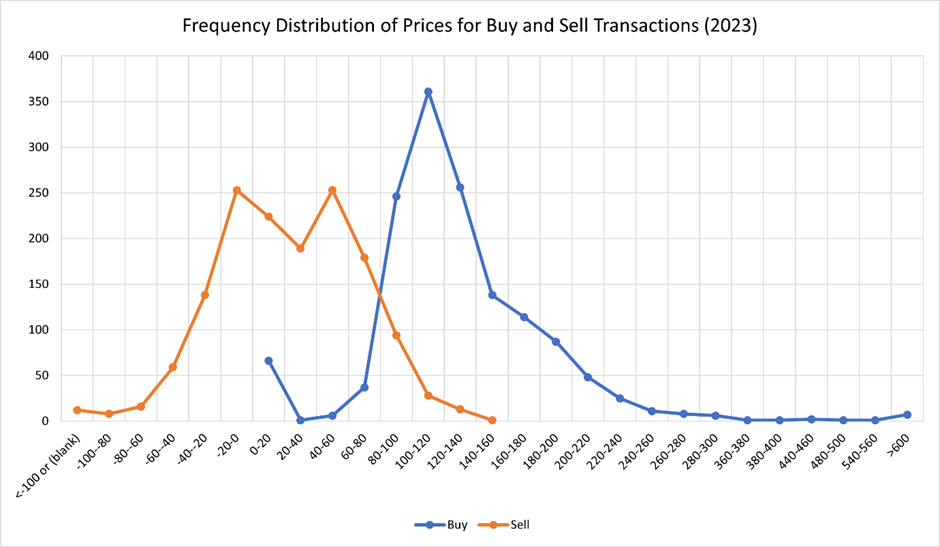
As you can see, we have perfected the art of buying high and selling low. A sizeable proportion of the sales transactions have a negative sales price. The peak is in the £–20 per MWh to £60 per MWh range. Most of the interconnector buy transaction prices are above most of the sales prices, with a very wide spread that peaks around £100 per MWh. However, there is a cluster of buys in the £0-£20 per MWh range and a sizeable number of buy transactions over £600 per MWh.
Interconnector Buys and Sells by Time of Day
It is also instructive to look at the volume of electricity traded by time of day. Figure 5 shows the volume traded in 2023 by time of day.
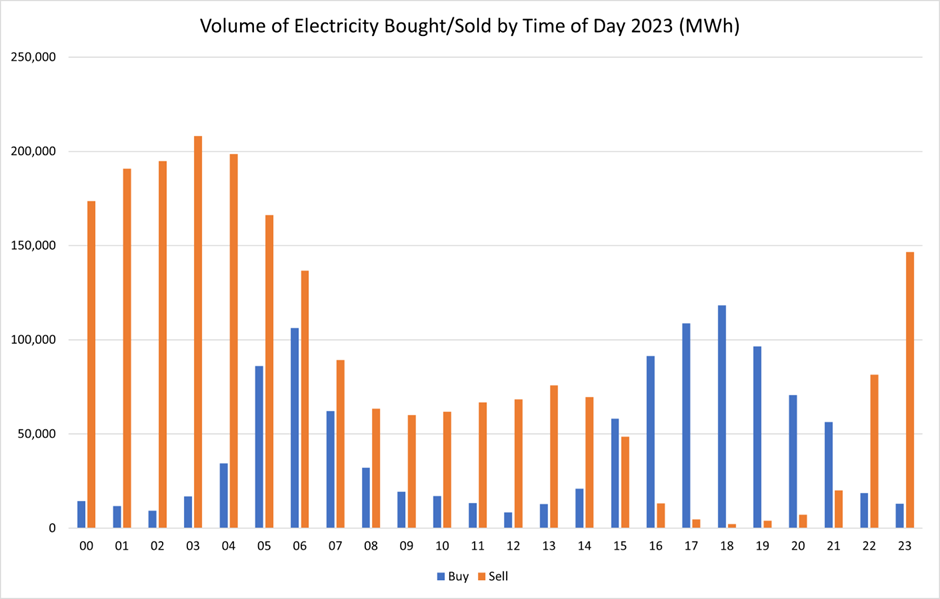
As we can see, most of the electricity sold is from 10pm to 6am. There is also a residual tail of sales from 7am to 2pm, reflecting the demand lull in the middle of the day. Most is bought in the morning peak from 5am to 7am and then again during the evening peak from 4pm to 9pm.
As might be expected, we are selling most when demand is low and buying when demand is high, reflecting the fact that we are not really in control of generation and cannot use it to match demand.
This is further illustrated by Figure 6 that shows the value of electricity traded by time of day.
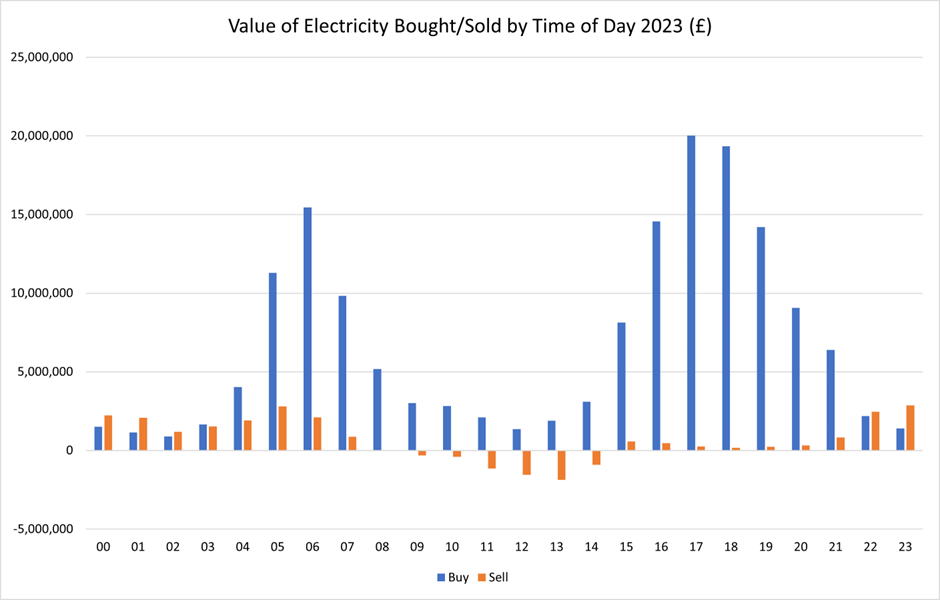
Even though the volumes sold during sleeping hours are high, the value of that electricity is low. In aggregate, the electricity sold during the middle of the day has negative value, so we pay others to take it off our hands. By contrast, we pay through the nose for the electricity we buy at peak hours.
Conclusions
Evidently, there is a massive disconnect between the rhetoric about interconnectors and the reality. Sadly, it is becoming clear that in many cases, when it comes to pronouncements involving Net Zero, the opposite of what the Government tells us is true. They are not cleaner – we tend to buy ‘dirty’ electricity and sell ‘clean’ electricity. They are not cheaper – we are being ripped off at every turn. And they are not more secure – we are dependent on our neighbours being willing to sell us electricity at times of scarcity.
The interconnectors are a giant swindle. They are nothing but an expensive sticking plaster over the reckless mismanagement of our dispatchable generation capacity. This can only be solved by investing in new sources of dispatchable supply (like gas and nuclear) so we can regain a position of strength. This investment would increase energy security, make us a price-maker in Europe and turn the interconnectors from an expensive liability into a valuable asset.
David Turver writes the Eigen Values Substack page, where a longer version of this article first appeared.
UPDATE: This article analyses only the National Grid auctions for trade of electricity across the interconnectors. Additional energy is traded across the interconnectors as detailed by Elexon, where the picture may be different. This may be the subject of an additional article.


To join in with the discussion please make a donation to The Daily Sceptic.
Profanity and abuse will be removed and may lead to a permanent ban.
A year ago I asked the dept for energy through my mp to conduct a grid stress test, whereby we had freezing temps for a month and no wind in December. I specifically asked for deaths and economic harms arising from this scenario, they point blank refused and gave me a go away pleb reply because they knew the answer. With such ppl in charge it’s inevitable the lights will go out.
Twenty years ago, when Private Eye was readable and Hislop wasn’t insufferable, they banged on about this topic relentlessly, (to no avail it would seem). I recall that the ‘slack in the system’ was a dangerously low 4% of demand. That would go some way to explaining the lack of a meaningful response to your query.
Richard North, who wrote articles and books with Christopher Booker (of Private Eye fame), used to write about this nonsense on his blog 15 years ago. He was predicting brown outs and wrote about the unreliability of renewables, the Drax faux green energy scam, rip off STOR schemes etc but his warnings were ignored.
Wokeman, what do you mean when you say “…whereby we had freezing temps etc”? It’s the “whereby” that I don’t understand. Not being confrontational – just don’t quite understand your initial sentence.
Yet we have been led to believe that wind and sun will give us “energy security” and reduce emissions to save the planet in this “climate crisis”. But insofar as a climate crisis actually exists the UK are only causing 1% of it, and anything we do here will have about as much effect as a mouse biting an elephant. All over the western world governments are leaving cheap abundant energy in the ground and fobbing their populations off with wind and sun, and spending taxpayers money on other fanciful energies like hydrogen and tidal etc. We can all see the result by having a quick check back over our energy bills. They are heading in one direction only —UP. There is a golden rule in energy production and that is to “produce it as cheaply as possible”—–Western governments adhering to UN and WEF pretend to save the planet mandates are producing it as expensive and unreliable as possible. Cheap abundant energy is the driver of the economy and the Progressive Left are using the manufactured climate crisis supposed to be getting caused by our CO2 emissions to control and regulate economic activity. They claim CO2 is causing a climate emergency, but remember CO2 is also something else. —–It is the one gas that can be directly tied to industrial capitalism and that is really what climate change politics is about. Control of wealth and resources, with climate as the plausible excuse. I recall the words of the former head of the National Grid (Steve Holliday) “We are going to have to get used to using electricity as and when it is available”. —-Yep, and we should all realise why.————— Anti capitalist politics masquerading as science and saving us from the manufactured crisis.
Excellent post
We have energy and financial illiterates in charge, it would seem.
Illiterates, full stop. Products of a so-called education system which rewards conformity, groupthink and unquestioning faith in the system.
“In what world does it make economic sense…..”. This one, on the financial planet. Those that invest in it evidently expect a return.
Highly subsidised inefficient industry. If government subsidised masturbation one could generate a return but nothing productive would be produced.
Of course our “friends” across the channel would never use our dependence on their supply of electricity to blackmail us ….. oh deary me no.
The original iteration of the EU after WW2 was the Coal and Steel Community ….. intended to prevent the more belligerent nations on the continent from having the ability to wage war. Then farming (ie food) was added to the list in the EEC. And now we have the EU and energy supply has been added.
The Not-a-Conservative-Government claims to have left the EU, but they are still applying EU law and regulations across vast swathes of our economy and governance.
It’s articles like this that make the DS so important. It’s a complex subject which David Turner has made very understandable.
The electricity generation industry seems perfectly aware of all this, they also know that the entire grid needs rebuilding but multiple times larger & they know none of these things can happen within the current net-zero timetable.
DS is very important, but what percentage of the population read it?——It is fine for you and I and all the other subscribers to vent about the phony climate crisis and the charade of an energy policy that is supposed to prevent it, but what is really required is mainstream airtime. Who remembers the Channel 4 Matin Durkin Documentary “The Great Global Warming Swindle” back in 2007? ——-That program really sent the climate and political establishment into a tizzy. We had all the activists spitting blood from their eyes on BBC etc that anyone could dare to question all their phony global warming politics masquerading as science. ——A One Hour Documentary at 9 pm isn’t much to ask is it, considering 99% of all media is poisoning us all with climate propaganda, otherwise known as “official science”?.———Mr Morrison, I am sure you agree that all of the great stuff you write in your articles on the DS could use a bit of a viewing by an unsuspecting public.
I should really have said Chris Morrison and all others who write on this issue.
This article isn’t about climate change or net zero, its about electricity pricing models.
The DS helps to equip people with counter arguments that might get through. You don’t have to be a climate change sceptic to have your eyes opened to the implementation failures. It’s a bit like putting Al Capone away for tax evasion, not his worst crime but a crime all the same.
People won’t revolt over whether sea levels are rising or whatever, but they might over their monthly utilities bill.
We have a Department of Energy and Climate Change. I am sorry but everything to do with energy is also to do with climate. Energy policies and anything to do with the price of energy is directly tied to assumptions about climate. The energy failures and the energy poverty that result from that are a direct result of climate politics.
Full original article on the author’s substack:
https://davidturver.substack.com/p/the-great-interconnector-swindle
I was aware of the gas networks but not the electric equivalent. No doubt the tax payer is underwriting along the way as well!
Security? My eye
how hard is it to cut a cable anywhere along its hundred mile length? or, turn off the juice if your feeling shirty with a particular country?
The only true energy Security is to supply your own fuel from your own country and make your own electricity, with enough capacity for a surplus should it be needed!
You can only do that with Coal Gas and Nuclear. They are the only on demand sources of energy. Everything else is part time.
True, I don’t remember the Germans controlling our power grid in 1940.
We are being led – by our government – into an era of ever increasing energy insecurity. It doesn’t take an Einstein to project into the future and see a time when we could be cut off from almost every source of electricity at will. What happens then when the climate alarmists wet dream of no electricity generation by anything other than a whiff of breeze or a pallid sun trying to break through the smog of chemtrails? We will freeze in winter unless we have the money and space to install some form of inefficient heat pump, which, of course relies on electricity so that’s out too. Log burners? They’ll come for those at some point and we’ll have ‘smoke marshals’ looking out for wood smoke. And all of it based on one side of a never publicly debated argument in which we could finely eviscerate ALL their arguments as cleanly as a fishmonger filleting a fish. The climate argument that never was and never will be because all the adherents or perhaps we call them worshippers at the altar of climate emergency have no other outlook or perspective other than what they’ve been indoctrinated with for the past 30+ years. I do wonder if common sense will ever return but I am not holding my breath. Although maybe I should because THEY have poisoned the very air we breathe too. If ever there was a time for a righteous rebellion, it is now in whatever form that rebellion can take. To sit and watch as THEY wage war against us is not an option.
Quality Aethelred.
Cheers, HP!
Demand for power has this year twice exceeded the peak demand of last year.
Perhapd all the immigrants can be employed on treadmills to generate some leccy.
To the phony planet savers Net Zero is an “investment”——-I wonder if any of our readers and subscribers on here can think of any type of investment where you don’t know the cost, you don’t know if it is practical or if the technology required can even be invented and you certainly do not know the outcome. —- Imagine buying a car or a boat or a life insurance policy but you have no clue how much it is going to cost, and you don’t know if the car or boat will sail? And you don’t know if the policy will ever pay out.
Well I am confident that the likes of Claire Coutinho would be so bamboozled by this article that it would sail way above her thick skull.
“Safe and effective” comes to mind for some reason.
The alleged energy security is predicated on ‘the wind is always blowing somewhere’ fallacy. In fact large areas of Northern Europe are becalmed at the same time in Winter for the same meteorological reasons, so if the wind isn’t blowing in Britain, it is likely it will not be blowing in Scandinavia.
The price of electricity is calculated due to a complex formula but the fact is, it is linked to the most expensive source being fed into the mix, not the cheapest. Mostly this is gas, so price of gas determines electricity prices not ‘free’ wind energy.
This has given rise to much weeping and wailing among the UK & European political slime about how to unlink gas from ‘renewables’ so we can get all that ‘free’ electricity.
Inter connectors are only of any use if they work. Have people forgotten already that they can be interrupted, like the second gas pipeline from Russia to Germany? Underwater cables, be they for power or data, can be destroyed. The UK did it even back in WW2. We should not be under any illusion that rogue states with the capacity to damage them know exactly where they are.
IMO investing in more gas fired power stations without fracking for gas in the UK is another bad idea with respect to energy self-reliance. we will be importing 80% of our gas by 2030 as it is let alone if we need more because of new gas fired stations. Bring back coal with modest investment in flue gas scrubbing. Like Lawson sensibly did in 81-83 we can stockpile coal at stations to avoid supply disruptions for months. China has just published record coal production and usage figures for 2023 and it’s only going to continue ramping up. We are being totally stupid on believing all of this green propaganda and making ourselves completely dependent on imports and as a result totally noncompetitive for any industrial base in this country. When have any doomsday green predictions actually happened? The Great Barrier Reef is blooming, the arctic sea ice is going great guns, Antarctic Ice is not receeding, Polar Bears are not dying out. Surely anyone can see like Javier Milei said at Davos recently that Green policies are simply poverty and subservience to central government and burocrats socialism in disguise?
Burn Parliament down, that’ll keep the electorate warm.
It don’t matter if this is dirty or expensive. If it’s not produced in the UK, our nut zero, eco-loons can stroke their egos and polish their CO2 free badges because it doesn’t count towards UK emissions.
Take the Prices Graph BACK to 2019 & you’ll see it’s even a Bigger Rip off than the conclusions. IS the same Graph for GAS. I have written to the CEO of Octopus & these Hedge Funders just get a Dummy to cut & base nonsense.
The DUKES report seems to show 2022 being a net export year and 2021 an import year, yet this article shows the opposite, can someone verify the source of the data used here?
https://assets.publishing.service.gov.uk/media/64c23a300c8b960013d1b05e/DUKES_2023_Chapter_5.pdf