
Fall is coming and the Covid propaganda machine, fuelled by manufacturers of Covid vaccines, is already here. Without a single trial of the effectiveness against death, lipid nanoparticles that contain mRNA and perhaps more (remnant DNA?) will likely be added to regular flu vaccination every winter. Perhaps as soon as this winter they will no longer be called booster doses.
It is therefore an appropriate time to revisit the claims of high effectiveness of the first booster, which was added to the two-shot protocol two winters ago. Using empirical data from three sources, I will examine here what is left after accounting for the healthy vaccinee bias (to be explained) and show peculiar features of the data that indicate even deeper estimation problems. Then, I will discuss another bias, called differential misclassification, which cannot be easily removed.
Considering these two biases (there may be others), the true effectiveness of the first booster was somewhere between mediocre and zero, and it is impossible to narrow that range. Therefore, all those observational studies of the booster effectiveness were useless.
Taking a new Covid shot every winter, whether called booster or not, has no empirical basis. The burden of proving effectiveness against death squarely rests on public health officials, and anything short of a randomised trial is unacceptable.
The healthy vaccinee bias
I devoted several articles to this topic, which may be summarised as follows:
A naïve comparison of Covid mortality in vaccinated people and unvaccinated people, even if age-adjusted, is grossly misleading because the former have a lower risk of death to begin with. At least part of their lower Covid mortality, if not all, has nothing to do with the vaccine. They are simply healthier people than their unvaccinated counterparts. That’s called the healthy vaccinee bias.
Or vice versa: unvaccinated people are, on average, sicker than their vaccinated counterparts, and therefore have higher mortality in general, including mortality from Covid.
Biases have been studied extensively by epidemiologists, biostatisticians and others. But if you run a search for “healthy vaccinee bias” on PubMed, a well-known website for biomedical articles, you will not find many publications. There are only 24 (August 31st), including recent correspondence in the New England Journal of Medicine on the booster effectiveness.
The healthy vaccinee bias, which many mistakenly call selection bias, is a type of confounding bias. Moreover, it is not restricted to a comparison of vaccinated with unvaccinated but is carried forward with additional doses. Those who took the third dose were healthier, on average, than those who took only two doses. We’ll see the evidence shortly. Shifting of healthier people along the sequence of doses has another peculiar effect. For instance, the ‘leftover’ cohort of two-dose recipients becomes relatively sicker than (more comparable to) the cohort of unvaccinated.
The healthy vaccinee bias can be removed, at least partly, but little has been written on the method. As far as I know, two research groups independently developed a correction method for biased risk ratios: one group from Hungary; another from the U.S. Unaware of that work until recently, I also proposed a method. Interestingly, it turns out that it’s the same trivial maths, expressed in two or three forms.
Regardless of the maths, the common underlying principle is simple. We know that vaccinated people are healthier, on average. Let’s use data on non-Covid mortality to estimate their Covid mortality, had they been as unhealthy as their unvaccinated counterparts. In other words, we estimate the risk in a counterfactual state, which is not observable. Indeed, one of several ways to define confounding and deconfounding is based on counterfactual reasoning. (There are other ways.)
To correct the bias, we need data on non-Covid mortality by vaccination status. That type of data has been consistently hidden. So far I am aware of three sources of data on non-Covid death of recipients of the third dose: England, Wisconsin and Israel.
Data from the Office of National Statistics (ONS), England
The ONS is the largest of the three sources. That agency periodically publishes an extensive dataset with many levels of stratification, from which I extracted monthly data for those who received the third dose versus those who received only two doses. In both cases, I chose only those people who received the last dose at least 21 days ago, avoiding sparse data for some other categories and ensuring comparability. The time period I examined was November 2021 through April 2022, shortly after the initiation of the booster campaign till the next (fourth dose) campaign.
The ONS data include age-standardised mortality rates for all ages, and also rates for 10-year age groups with additional age-standardisation within those age groups. I chose the latter rates. The results were nearly identical using non-standardised rates, which is not surprising given the narrow age bands.
The example below shows that the rate of non-Covid mortality in the oldest recipients of only two doses was 2.19 times that rate in their age-matched counterparts who received three doses. Those who continued to take the booster were healthier on average. That’s the healthy vaccinee bias, which was present in every age group in every month. The ratio 2.19 is called the bias factor. Its value ranged from 2 to 5 in most of the ONS data I extracted. The lowest value was 1.7 and the highest was 8.1.
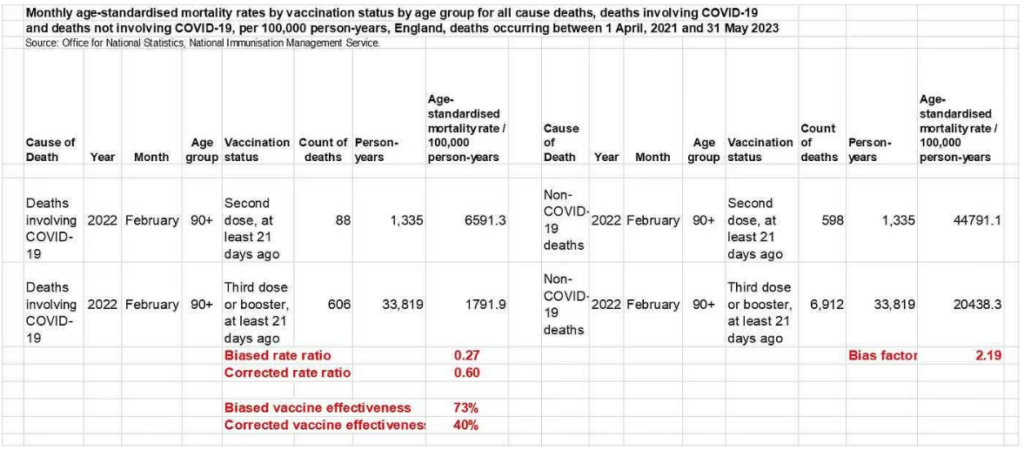
A naïve analysis produces a risk ratio for Covid death of 0.27 (vaccine effectiveness of 73%) attributed to taking a third dose versus taking only two doses. Both are biased estimates. To compute a corrected risk ratio we should multiply the biased risk ratio (0.27) by the bias factor (2.19), as explained elsewhere.
Rounding at the end of the computation, we get a corrected risk ratio of 0.60 (corrected vaccine effectiveness of only 40%).
A few methodological points:
First, as I noted earlier, the use of actual rates rather than standardised rates has made no material difference. The age groups were narrow enough. In the example above, we get exactly the same result whichever type of rate we use because the standardised rates were almost identical to the actual rates.
Second, when using actual rates, population denominators cancel out. Simple maths shows that we can get the corrected risk ratio by using only counts of deaths. I will skip the technical derivation and just show the computation for the example above:
Odds of Covid death (vs. non-Covid death) in third-dose recipients: 606 ÷ 6,912 = 0.088
Odds of Covid death (vs. non-Covid death) in two-dose recipients: 88 ÷ 598 = 0.147
Corrected risk ratio: 0.088 ÷ 0.147 = 0.60
Third, serious questions have been raised on the ONS denominators. However, this method of correction for the healthy vaccinee bias relies only on counts of deaths (which do matter a lot.) We will return to this topic at the end when I discuss another important bias: differential misclassification of the cause of death.
Fourth, sparse data (few deaths) is a common problem in estimation of vaccine effectiveness, especially when the sample is stratified. In the interval I analysed for the booster effect (November 2021-April 2022), it was not an issue. The ONS dataset is large enough to produce stable results at those levels of stratification.
Fifth, I restricted the computation to age 60 and above for two reasons: 1) the unbrainwashed reader knows that Covid has never been a public health issue for younger populations; 2) The number of Covid deaths in younger age groups was small.
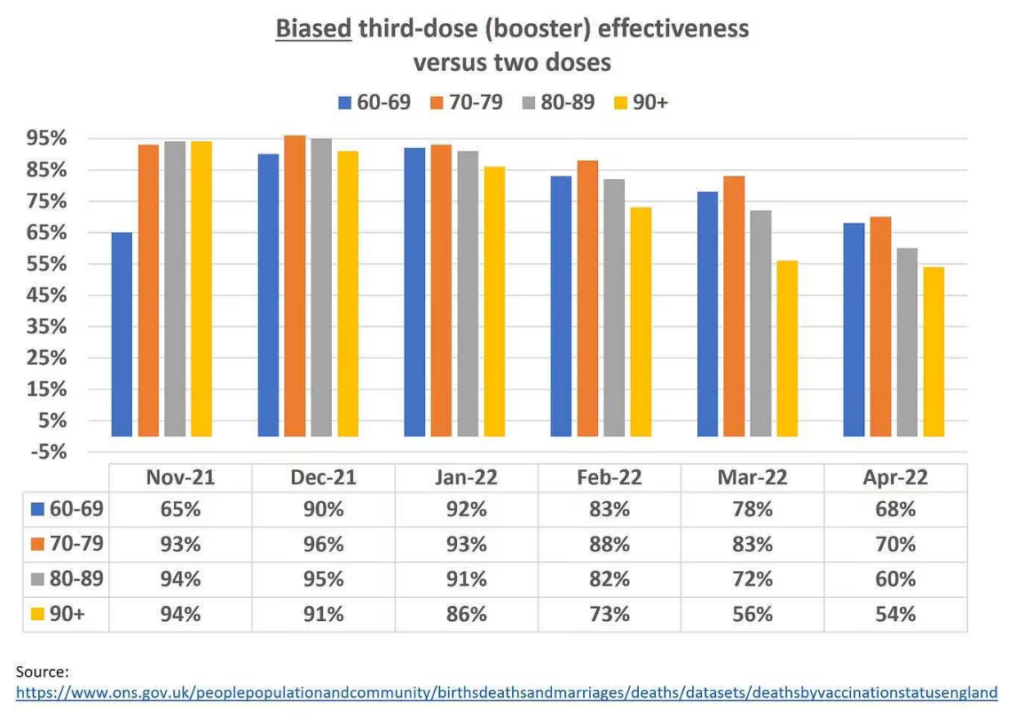
The graph below shows a naïve analysis of the ONS data. The estimates of high effectiveness are useless for at least one reason: the healthy vaccinee bias. The ONS acknowledges the point, without using the word “bias.” It writes:
The ASMRs [age-standardised mortality rates] are not equivalent to measures of vaccine effectiveness; they account for differences in age structure and population size, but there may be other differences between the groups (particularly underlying health) that affect mortality rates.
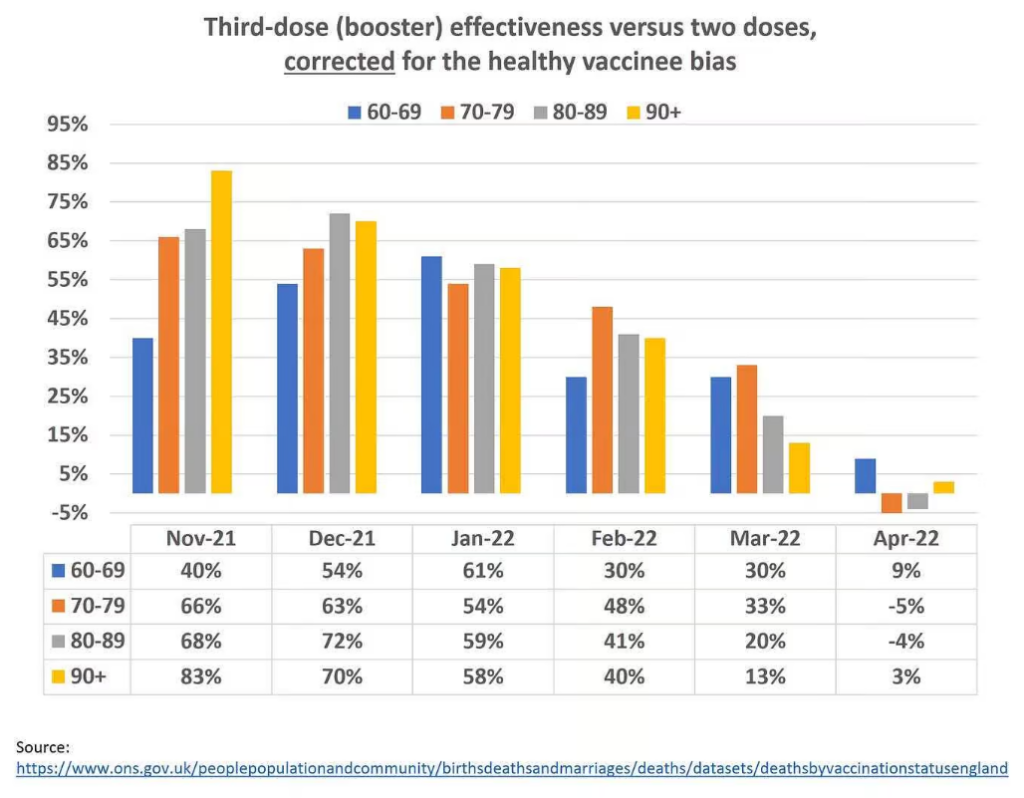
Corrected estimates of effectiveness are shown in the graph below. Comparing the second graph to the first, it is apparent that the magnitude of the healthy vaccinee bias was large, and in April 2022, biased estimates of 54% to 70% were essentially nullified. We also observe rapid and complete waning of effectiveness, which was not seen in the biased results.
Nonetheless, new questions arise after the correction:
- Why does effectiveness appear to increase with aging in many pairwise comparisons? For instance, why is it twice as high in the oldest than the youngest in November 2021? We expect to observe the opposite, given well-established knowledge from immunology.
- Why does effectiveness increase in the youngest age group between November 2021 and January 2022, and then rapidly decrease? Is there any biological explanation?
- Why is the linear, downward trend most consistent and sharp only in the oldest age group?
- Why are the estimates for the four age groups largely equalised by January 2022, and then diverge again?
Some features of the data simply don’t make sense. Why?
I offer the following answer to all these questions: either we did not remove the healthy vaccinee bias completely and uniformly, or some other bias-related processes have operated. Although we should confidently reject the original, biased estimates, we cannot endorse the new estimates as valid, final substitutes. They do not even qualify as upper boundaries of effectiveness. True effectiveness, if meaningful at all, should be much lower.
Data from Wisconsin
Data from Milwaukee County, Wisconsin is presented in a study by Yuan et al. (preprint) or Atanasov et al. (peer-reviewed version). Their article is among the best manuscripts I have read in my professional career, which does not mean that I agree with a statement such as “COVID-19 vaccines have saved millions of lives”. They did not. Nor do I agree with their claims about the benefits of the booster, as you will shortly see.
That article is exceptional on several counts: 1) independent discovery of the method to remove the healthy vaccinee bias; 2) thorough analyses at a level I have rarely seen (if you bother to read a lengthy appendix); 3) thoughtful discussions of almost every issue I could think about; 4) full exposition of the data. To my surprise, however, the phrase “healthy vaccinee bias” is never mentioned, nor is there any citation of previous work on the topic.
The authors have studied vaccine effectiveness of various doses against Covid death in residents of Milwaukee County, Wisconsin. From their overwhelming amount of data, I was able to extract and compute the numbers in the table below, which is essentially the same kind of data as the ONS data and the same kind of analysis — in two age groups rather than four, over three months (combined). Even after grouping, the data are sparse (a small number of Covid deaths).
As you can see, the results are peculiar. There was only moderate healthy vaccinee bias in ages 60-79 and no bias at all in ages 80-plus. What kind of healthy vaccinee bias was accounted for? Why do we observe a bias factor of 1? Following correction, the booster effectiveness in ages 80-plus was somewhat higher, not lower, than in ages 60-79. Are these the expected results?
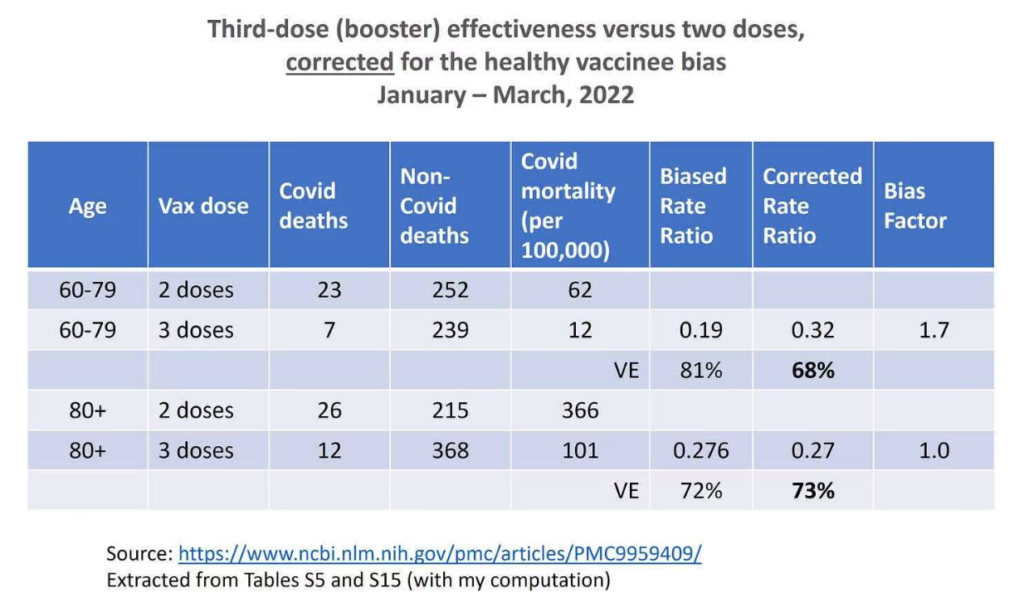
The authors write that “…selection effects, unless controlled for (through our CEMP measure or in another way), can produce large biases in VE estimates”. That’s correct, and we just saw it in the ONS analysis. But for some reason these effects did not seem to operate in their data for elderly booster recipients versus two-dose recipients.
I commend the authors for creative explanations of anomalous results (Appendix, pages 13-14). Apparently, no explanations were needed for the ONS data. The healthy vaccinee bias never vanished in any age group.
An excellent analysis cannot remedy problems that are inherent in the sample. It may be a sparse data problem alone or a lot more. Either way, we should have no trust in the new estimates.
Data from Israel
A letter to the editor of the New England Journal of Medicine has recently generated considerable interest in the healthy vaccinee bias. Høeg and colleagues astutely used data on non-Covid mortality from a study of booster recipients in Israel. In those data, biased vaccine effectiveness of 95% has turned into null after correction for the healthy vaccinee bias. The data are summarised below.
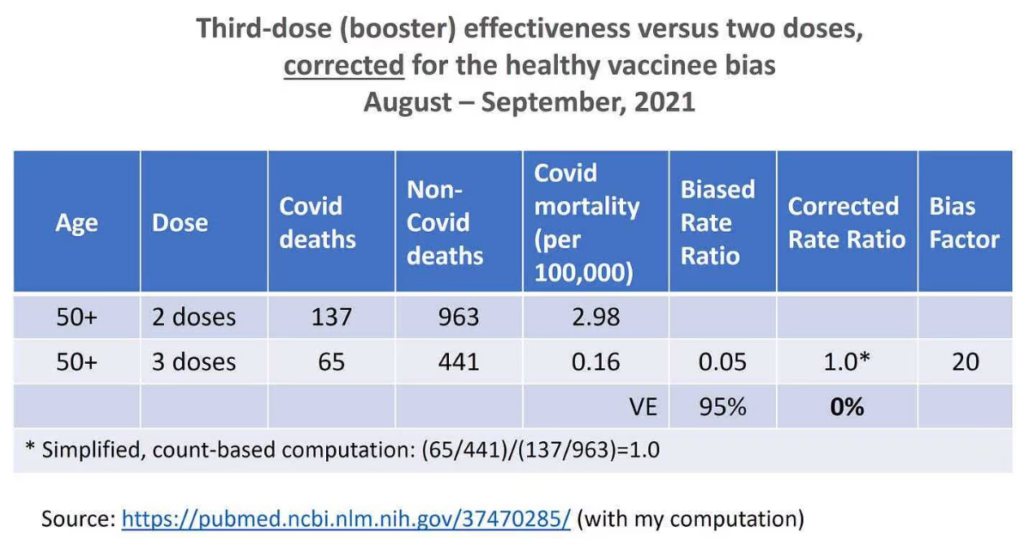
When a new method is introduced, new questions often arise, which are highly technical. Rather than correcting the bias using counts, rates or age-adjusted rates, it is also possible to correct the bias by a two-step procedure. First, we fit a multivariable regression model to remove as much confounding as we can, for both Covid death and non-Covid death. Then, we apply the counterfactual-based correction for the ‘leftover’ bias. The results may differ. For instance, in the study from Israel, the second method generated vaccine effectiveness of 57% rather than 0%.
- Are both methods valid, in the statistical sense of ‘unbiased results’?
- If so, which is preferred from a statistical perspective (say, smaller variance)?
The discussion is far too complicated to be included here. I will just say — for those with advanced statistical knowledge — that the two-step method is a hybrid of two approaches to deconfounding: classical conditioning and counterfactual reasoning. Whether that hybrid is justified, even if valid, is questionable. On the other hand, I am not aware yet of any overt pitfall of the single counterfactual approach, namely, the approach of Høeg et al., and mine.
Differential misclassification bias
Imagine two people who died in a hospital. Patient A received only two doses of a Covid vaccine; patient B received three doses (‘up to date’). Suppose Covid was the cause of death in both patients. Nonetheless, in our imperfect world there is misclassification, and one of the two deaths, or both, might be recorded as a non-Covid death. What kind of misclassification might be expected?
It depends on vaccination status.
We may assume that physicians are more reluctant to attribute death to Covid in a vaccinated patient than in an unvaccinated patient “because the vaccines are highly effective”. Still, they do record Covid as a cause of death in vaccinated patients, but they might do so differently for patient A (two doses) versus patient B (three doses). The Covid death of patient B, who is ‘up to date’ on vaccination status, is more likely to be mistakenly recorded as non-Covid than the Covid death of patient A who is not. By analogy, think about patient A as ‘unvaccinated’ and about patient B as vaccinated. Which Covid death is more likely to be missed? The latter.
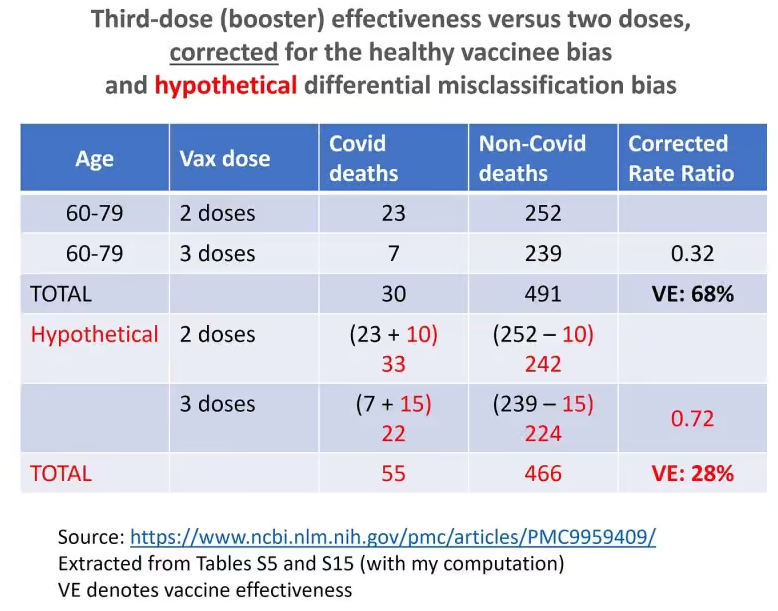
The phenomenon is called differential misclassification bias, and I have no doubt that it was operating universally for various reasons: the mindset of physicians, PCR testing protocols, and so on. Nonetheless, it is difficult to quantify and remove the bias. When differential misclassification is added to the healthy vaccinee phenomenon, the bias is compounded. To illustrate the point, hypothetically, I used the sparse data from Milwaukee County, Wisconsin.
Suppose 5% of 491 non-Covid deaths in ages 60-79 were actually Covid deaths, which were misclassified (because physicians were convinced that the vaccines were highly effective and for other reasons). Nonetheless, there was differential misclassification as explained above: 6% of 239 non-Covid deaths in three-dose recipients (‘up to date’ vaccinated) were Covid deaths, whereas only 4% of 252 non-Covid deaths in two-dose recipients (‘unvaccinated’) were Covid deaths.
The computation is shown in the table below. After correcting for both differential misclassification bias and the healthy vaccinee bias, we get only 28% effectiveness of the third dose.
The authors of that study acknowledged that estimated effects would be biased if “the degree of undercounting differed systematically between vaccinated and unvaccinated persons”, but they “have no reason to expect that condition (ii) holds”.
As I wrote above, I do not share their belief. There are plenty of reasons to expect differential misclassification, and those of us who followed PCR testing practices in Israel, for example, have ample evidence.
I believe that some day, observational data on the effectiveness of Covid vaccines will be taught in epidemiology courses as prime examples of the healthy vaccinee bias, misclassification bias, other biases and other distortions.
To summarise:
The true effectiveness of the first booster was short-lived, if meaningful at all. Peak protection was somewhere between mediocre and zero, and it is impossible to narrow that range. Therefore, all those observational studies of the booster effectiveness were useless.
Taking a new Covid shot every winter has no empirical basis. The burden of proving effectiveness against death squarely rests on public health officials and anything short of a double-blind, placebo-controlled randomised trial is unacceptable. And that applies to the flu shot as well.
Dr. Eyal Shahar is Professor Emeritus of Public Health at the University of Arizona. This article first appeared on Medium.


To join in with the discussion please make a donation to The Daily Sceptic.
Profanity and abuse will be removed and may lead to a permanent ban.
Yes this UKHSA woman is really selling it. I think we should all listen to her <2min spiel then laugh and take the Mick out of her mercilessly. Then we can send her to Ms Spring to get verified….preferably recalibrated at the same time!
https://twitter.com/chrislittlewoo8/status/1699465391469130194
Ho my goodness! Doesn’t this bunch want to make you weep?
Yeah, we don’t really know what this new variant looks like, so we’ve packaged up any old guff we could get our hands on and we’re sure this will be absolutely fine. Honestly…
“The Evidence is Accumulating that the ‘High Effectiveness’ of the Covid Booster was Mostly Bias”
Yes I realised this 3 years ago so didn’t have the jab! The whole tyranny was/is just a bottle of fish!
The people rolling up for the next jab are the very same people who’ll be wearing masks, even without being told to, and the irony of that will be totally lost on them. They may as well wear a T-shirt which states ”I’m an avid fan of mainstream media”. They need their daily dose of Kook-Aid in order to remain members of the Covidian cult. The only thing these morons have immunity against at this point in time is red pills. Let natural selection do its thing, I’m past caring.
“The only thing these morons have immunity against at this point in time is red pills. Let natural selection do its thing, I’m past caring.”
Entirely agree. If some of the sheeple fall for the booster con they deserve whatever misfortune they might suffer.
And have a look at Norman Fenton’s description of how the efficacy of the drug in question can be manipulated statisically: https://www.youtube.com/watch?v=6hHKr9Ig36E
There were 28 different therapies/vaccines used across the planet with no control groups against a virus type that is not novel and is known to mutate. Tony Blair said it is possible to mix different ‘therapies’/vaccines and he knows everything, much like ‘vaccinate the entire planet’ Bill. I have attached two graphs from the Johns Hopkins Covid Map. Please note the relationship between Deaths, Cases and Doses against timeline. Perhaps I should ask Marianna Spring to help out with interpreting what the data is saying?
We cannot fight this with maths and graphs and logic and reason and patient argument.
We need to learn to fight this with pathos.
It’s too late for logos. And ethos is clearly corrupted.
What are we fighting for, actually?
It’s slightly confusing that at the start of the article it’s mentioned that mRNA is likely to be added to flu vaccines, but then the rest of the article is about covid vaccines. Is it true that flu jabs will contain mRNA either this winter or in the near future? Does this mean they’re going to see increased safety problems? Whatever the answer to these questions is I’m not going to be having a flu jab (I became eligible for them this year), preferring to rely on natural immunity.
For reference here is a list of all the therapies/vaccines developed for the virus from Wuhan – there were/are 28:
Abdala
CanSino
Corbevax
Covaxin
COVIran Barekat
EpiVacCorona
IMBCAMS
J&J
KCONVAC
KoviVac/Churnikov
Medicago
Medigen
Moderna
Novavax
Oxford/AZ
Pfizer–BioNTech
QazVac
Sanofi/GSK
Sinopharm (Beijing)
Sinopharm (Wuhan)
Sinovac
Soberana Plus
Soberana02
Sputnik Lght
Sputnik V
Turkovac
Valneva
ZF2001
and here is a list of all the effective therapies.
(you’re welcome)
The therapies that were effective for my wife an I were
Vitamins D3 & K2
Zinc
Quercitin as an ionophor for the above
Not eating shit (we’re Carnivores, in fact, so super fit anyway).
Fresh air (lockdown and social distancing were mostly notional in our small Somerset village).
They want to make all jabs mRna based…. to finish the job off
Or to enhance their balance sheet, by reducing the development cost and selling more of it.
I’m afraid I stopped reading at “Unvaccinated people are, on average, sicker than their vaccinated counterparts, and therefore have higher mortality in general, including mortality from Covid.” because I don’t accept the assertion, nor do I consider them to be vaccines.
However, let’s not also forget the sophistry created by waiting 14 days after the jab (or booster) to consider the person ‘vaccinated’. Anything at all that happens within that fortnight (such as a massive adverse reaction) is put into the wrong category – even without covid infections, the vax would automatically seem superior.
I just don’t get the ‘healthy vaccinee’ concept at all. I thought the article would show there was no such thing but I got a bit bogged down reading it. I’ll maybe try reading it again later. Then again…
I don’t think they necessarily mean this in a bad way, that “anti-vaxxers” are less healthy. More that people who had, say, one or two doses and then didn’t continue to have the rest, were likely to be very unwell in the first place and therefore less likely to be vaccinated. For example my FIL didn’t have the booster as he was very unwell with terminal cancer, and died shortly after. Of course there are some people (like us) who didn’t have the vaxx for other reasons, not because of poor health, but I think the results will be skewed by those others.
But they are HIGHLY effective! The more jabs you have, the more likely you are to get Covid again, and the more likely you are to do sever damage to your body. What’s not to like?
Free Speech out of London Translation: “Mostly Biased” = BS
Interesting to know if vaccine caused deaths are included in the noncovid deaths. Would change the calculation for taking the jab.