After months of waiting, the U.K. Health Security Agency (UKHSA) has updated its ‘Vaccination in pregnancy’ tables in its ‘COVID-19 Vaccine Surveillance Report’.
Many of us have been complaining that the tables have not been updated for over six months, with the last set of data inputted in June 2022. Maybe it was working together with the ONS, which updated its ‘deaths by vaccination status’ data last week. The UKHSA data have now been updated to November 2022. I don’t understand why there is still such a big delay, but any update is better that nothing.
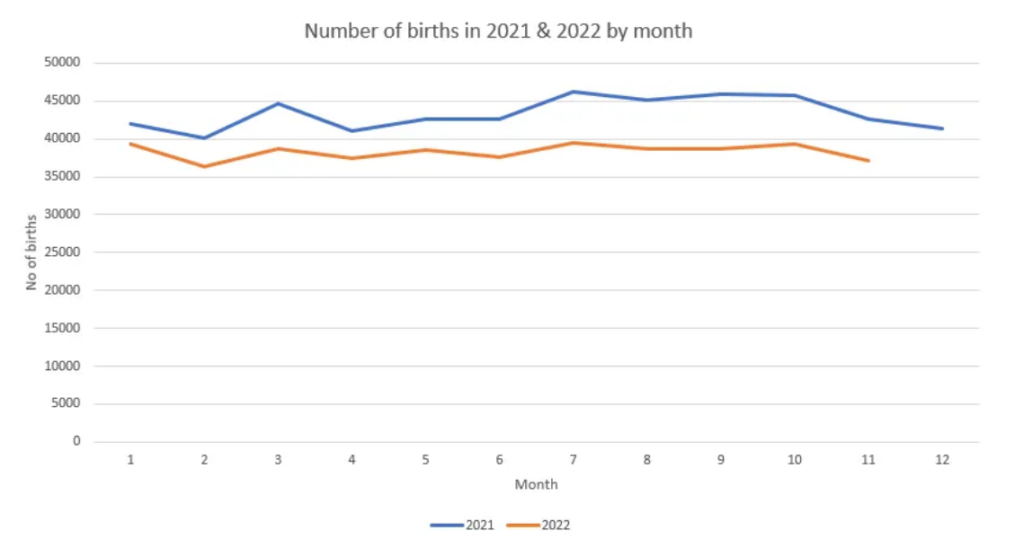
Previously, it has been noted that there were big drops in births when comparing 2022 with 2021. I can recall reading someone connected with the UKHSA or ONS saying that this was probably due to a data lag. Well, the updated data are here and they are still as worrying as before. The updated data have slightly decreased the number of births in 2021 and slightly increased the number in 2022, but not by much.
As the data only run until November 2022, I compared the number of women giving birth up to November 2021 with the number in 2022. In total between January and November there were 478,382 births in 2021 and 421,284 in 2022. That’s 57,098 fewer births in 2022, which is a drop of 11.9%.
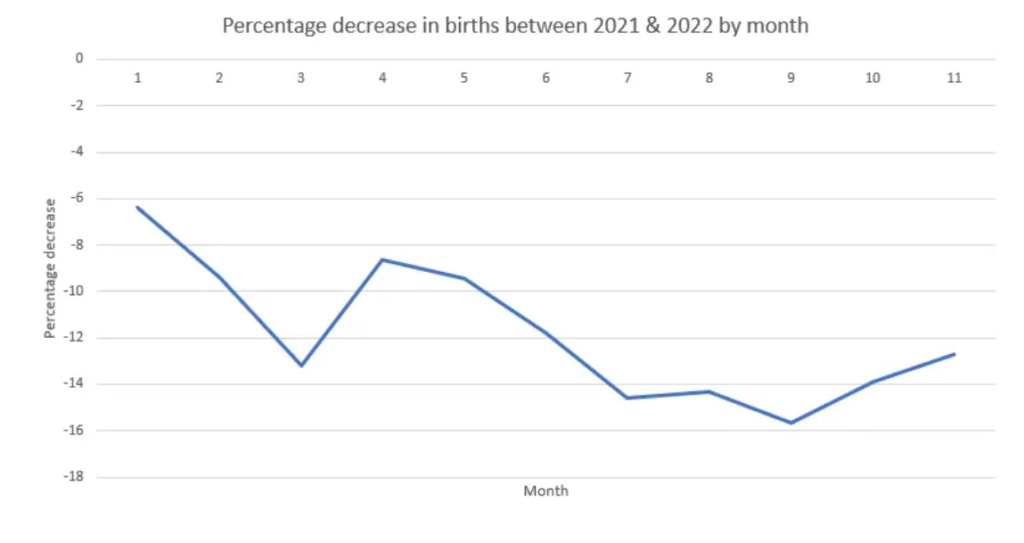
This next chart shows the percentage decrease in births by month. As you can see, the biggest decrease occurred in month 9 (September) with a decrease of 15.7%
The vaccine surveillance report’s own graph shows this drop. I have drawn a red line to show where the drop off starts, which coincidentally matches the peak of the first dose in pregnancy figures.

The report emphasises that there is nothing to worry about and that studies have shown the vaccine is safe in pregnancy. It presents a number of graphs showing:
- percentage of live-born babies at term without low birthweight;
- percentage of live-born babies at term without low birthweight by age;
- stillbirths;
- low birthweights; and
- premature births.
Its graphs attempt to show that there isn’t much difference between vaccinated and unvaccinated mothers. However, in my opinion, these data don’t show much and could be considered disingenuous because the authors never compare with unvaccinated women. Instead they use the term “no doses in pregnancy”. This means instead of being a purely unvaccinated control group, women who were vaccinated before they were pregnant are lumped in the same group.
Next, I analysed the drop in births by ethnicity. I used the September to November 2021 data from the week 11 2021 vaccine surveillance report and compared with the September to November 2022 data in this latest report.
(A note to the UKHSA – your table columns are still labelled “April to June 2022” whilst the table heading says “September to November 2022”. Clearly a cut and paste job which doesn’t instil confidence with such an important dataset.)
The report compares births in Asian, black, mixed, other, unknown and white women.
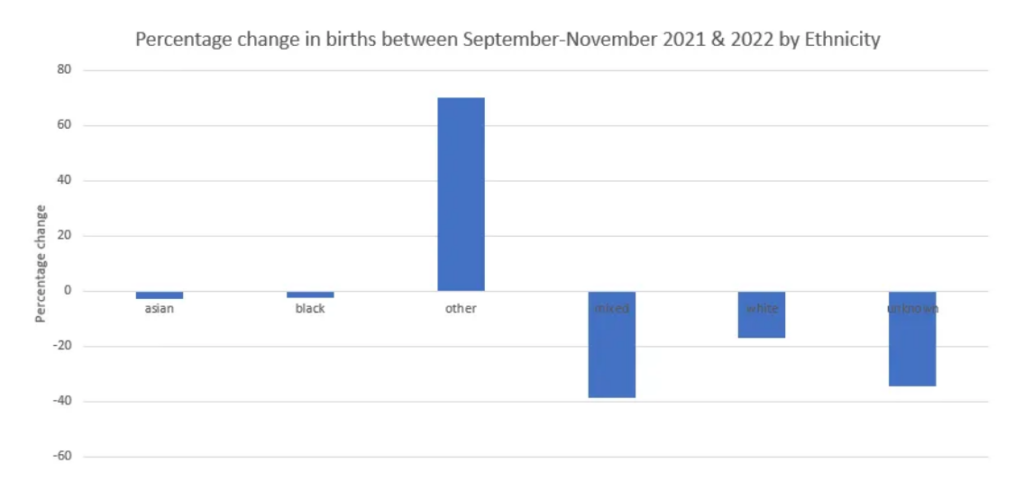
There is a big increase in ‘other’ births but in reality the difference is just a few thousand. The rest of the categories show drops ranging from -2.5% in black women to -38.7% in mixed race women. The vaccination rates at the time of delivery are as follows: Asian (75.9%). Black (53.9%), Mixed (62.1%), Other (64.9%), White (78%) and Unknown (58.9%).
So there is no clear pattern between percentage of women vaccinated and changes in number of births.
Next, looking at deprivation with 1 being most deprived and 5 the least deprived.
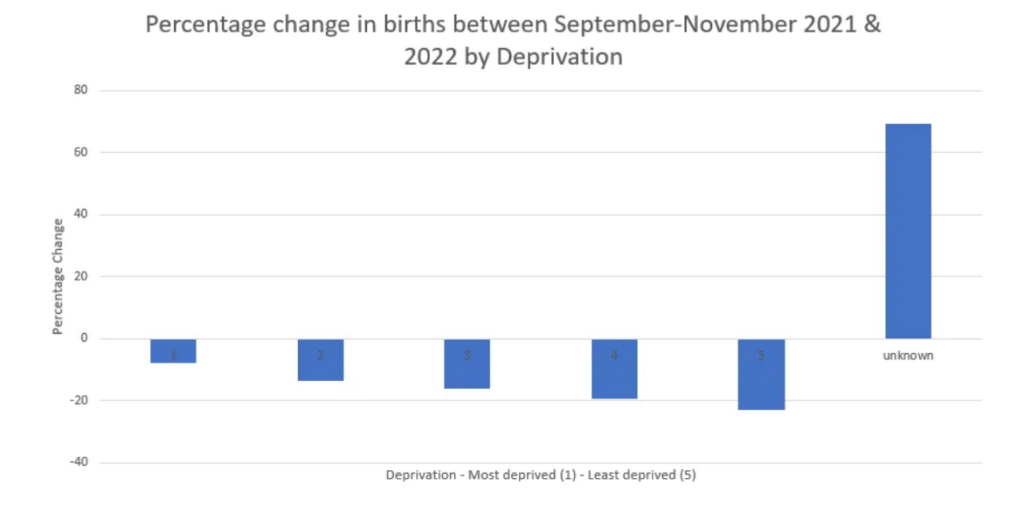
This time there is a clear pattern between deprivation status, vaccination status and decrease in births. Vaccination rates by deprivation status are as follows: 1 most deprived (63.7%), 2 (71.2%), 3 (77.8%), 4 (83.3%), 5 least deprived (87.2%).
Interestingly, the more deprived, the lower the birth rate drop. This is also coincides with a lower percentage of women vaccinated.
And finally by age.
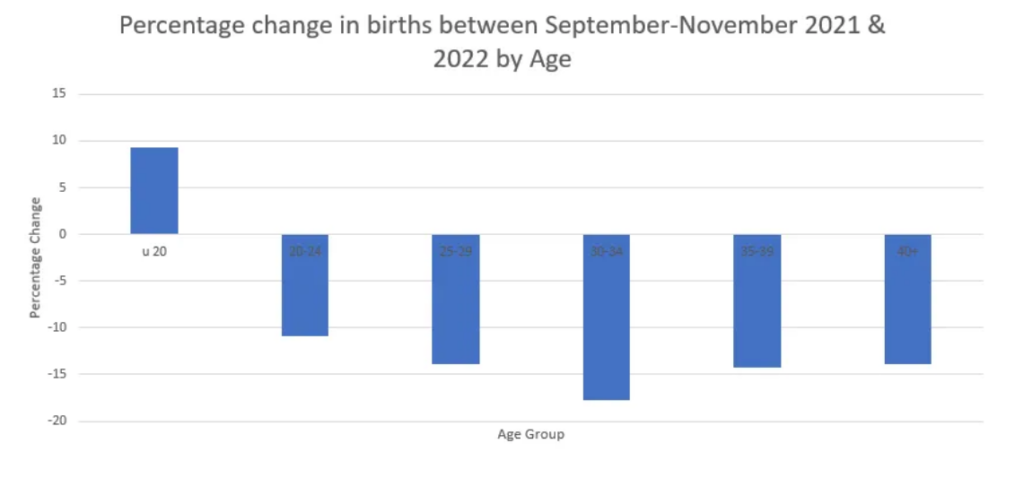
Here the under 20s show an increase whilst the other age groups drop in number of births. The greatest drop is in the 30-34 year olds at minus-17.7%. Vaccination rates for this group are as follows: under 20s (46.8%), 20-24 (61.7%), 25-29 (69.8%), 30-34 (79.8%), 35-39 (82.7%), 40+ (81.8%).
Hopefully this massive drop in births can be explained by a data lag or maybe because there was a post-lockdown bounce in 2021, so numbers dropped back down in 2022. However, if this was due to a data lag you would expect the drop to be consistent in the different categories highlighted above.
Perhaps the drop is due to the ‘cost of living crisis’ – but then would you not expect the drop in numbers to be in poorer or younger women? Maybe it shows how the middle class are being hit the hardest?
But the effects of vaccination should not be dismissed and if I had the raw data I would want to look at this closer. The beginning of the drop coinciding with the peak in first vaccinations is worrying, as is the chart showing that the more wealthy and more vaccinated women are having fewer babies.
This post first appeared on the Naked Emperor’s Substack page. Subscribe here.


To join in with the discussion please make a donation to The Daily Sceptic.
Profanity and abuse will be removed and may lead to a permanent ban.
Honestly, how many more years will lockdowns be blamed for lazy bums being workshy, or irresponsible parents not making sure their kids are in school?
Also, perhaps somebody in the know can answer me this but, I was under the impression in the UK you had to attend the dole regularly and provide proof you were actively looking for work. Is this no longer the case? Is languishing at home, collecting benefits now a lifestyle choice?
Surely people should be made to work in warehouses, factories or in the fields harvesting caulis in the cold, and if they turn their noses up they get their dole money stopped? Beggars can’t be choosers and even if it’s a crappy job it’s a foot in the door and you can surely look for something better once in employment. This article reads like working in the UK nowadays is optional.🤯
My sentiments exactly!
“I dont feel like coming to work today”
“Are you ill?”
“Not really, just fed up”
“OK, your sacked, ill make sure you’re paid all you’re owed to date, bye”
That was in my day!
I’ve posted this on similar posts on FB (and possibly here, I can’t remember) but what are we asking the young to work for?
It was bad before COVID but the huge inflation during and since mean other than those with wealthy parents most will never own their own home and the rental markets such a mess even a secure rented home is rare.
Blair’s ridiculous plan for 50% to attend university has led to huge numbers attending who are taking unsuitable or unnecessary degrees.
However because that’s become the norm job’s that don’t “need” a degree (police is an obvious example but there’s plenty more) advertise for them so it becomes a self fulfilling loop.
The employment market has changed and is continuing to do so and with improvements in AI and automation long term employment prospects are bleak for the young.
The tax burden is the highest since the war and will keep rising. Along with the overall cost of living.
The young are taxed to pay the (increasing) pensions of the old while at the same time being told they won’t get one when they get there.
I’m 42, work hard/long hours (including in the past warehouse, factories and cutting caulis) and I own my own home (2 years left on mortgage). If I didn’t have that I seriously doubt I’d work the way I do/have previously…
To be clear I’m in favour of (and expect) people to work. However as I said at the start, what are they working for? I’m realistic enough to understand people need an incentive to work for.
As I’ve said to my dad (67) on several occasions when we discuss this matter, the world he grew up in and raised me for has gone.
It’s a shame that people feel like that
I am very much in a bubble – we employ lots of young people who earn a very good living – they are lucky enough to be able to do the work, and they work hard. But we are a small firm. What I have heard and seen about larger firms, which seem to be more common in many sectors because of consolidation, often seems awful to me – talent and hard work are not always recognised or rewarded
Back when I was 18 college wasn’t going well and my manager at my part time supermarket job was aware and he spoke to the store manager. I was pulled into the office on my next shift and offered a full time job as his (additional) assistant manager.
I took it and had to work hard but it enabled me to work up across the next 17 years and is a large part of why I’m where I am now.
That would be impossible these days due to the rigidity in structures and requirements to advertise etc.
Also it started while I was there but has accelerated since, with the move to “pay equalisation”.
When I started I was paid a lot less than the other assistant manager but he was far more experienced so didn’t bother me. By the time I left my pay rises were being held back to increase the pay of less experienced managers with smaller departments.
The days of a store manager being able to say you do a good job here’s an extra £1,000 are gone as everything needs to be fair and equal if someone (particularly if they have a protected characteristic) complains…
It’s good that you were able to work your way up. I think it’s hard for a large organization to make sure the right incentives are in place from bottom to top. Smaller companies probably don’t survive long unless they reward good performance, and the boss of a small company is surely going to look after the good staff, because his success depends on them.
I don’t know what the answer is.
I completely understand why a business with approximately 1,400 sites and 140,000 employees needs rules to maintain standards across all sites. It just doesn’t help when you’re on the wrong end of those rules…
I’m pleased your business is going well and your staff are well paid. Sadly there’s not enough companies like you (because of consolidation) to go round
I guess there are benefits to the consumer from businesses that size, and possibly benefits to staff (more job security, once you are in). But it would drive me nuts to work in one.
All the woke stuff doesn’t help, ditto the ridiculous obsession with “safety”
Mrs ToF used to work for Pizza Express. When she started, a lot of the restaurants were franchises where the owners had a lot of autonomy regarding the staff. For some reason they all got bought out, but before that certainly the branch Mrs ToF worked in was not at all “corporate” in feel but was very much a creature of the three owners. That model appeals to me more than what we’ve ended up with.
We had a Budgens where we used to live that became a franchise for a while, and it improved massively when that happened.
Ha… It’s been a “lifestyle choice” for decades…
There certainly is some degree of weight to be apportioned to lockdowns being responsible for the workshy….
The Marxist ideology is conveniently favorable to many… after all, UBI is straight out of the Marxists playbook…
Rely on the State
Be controlled by the State…..
Libertarians are a rare breed…
“I’m always surprised how few Libertarians exist!”
I’m going in that direction, in my old age…
Apparently, most interviewing these days is done online, as is claiming for benefits. Much easier just ticking boxes that sitting in front of someone and actually explaining what you have been doing to look for work.
I think one of the sure fire ways of wangling the benefits system is via the ‘mental health’ route. I think GPs are far too much of a soft touch when it comes to doling out sick notes for sackless people to pass on to the benefits office ( and if you start mentioning suicidal ideation you’re golden. Especially given how long it takes to see an actual mental health professional who’d evaluate you ) to say this person is unfit for work due to debilitating depression, or some such claptrap, so then that person knows they’re good for several months, just so long as they can keep convincing their doctor they’re too depressed to work.
The problem with this is it becomes a self-fulfilling prophecy for many because the longer you spend out of work the more likely you are to fall into actual depression, as everybody knows, for most people anyway, going to work even in a crummy job you might not like brings many benefits, such as increased confidence/self-respect/self-esteem, which come as a result of having responsibilities and personal accountability when you must be on shift for a certain time and fulfill your obligations to your boss throughout your workday. Keep doing that for a while then you’re more likely to get a good reference, you’ve job experience so you can maybe move on to something better where you’ll be happier.
We’ve all been there. I think my worst job many moons ago was working in a fish factory. I needed to get 2 buses to work and back and stank of fish. I lasted 6 days.😳🐟🤢
“I was under the impression in the UK you had to attend the dole regularly and provide proof you were actively looking for work.”
You are out of date.
Not since the 1970s when it was decided the unemployed were “entitled” to holidays just like everyone else and could draw their dole in advance so they could have a super time on the Costa del vino.
Claims that people on holiday weren’t available for work were contemptuously dismissed… Tory scum!
“mystified economists”
From the same team that brought us “baffled doctors/scientists”
Pay people not to work. People don’t work. It’s puzzling.
Abolish the welfare state and State-run public services and watch employment levels surge, vast improvements and decreased costs of the now privatised public services.
Every public service now undertaken by the State once was provided by tte private sector until nationalised in order to extend the power and control of the State and those running it, over the people.
Rachel Reeves, the Chancellor, has promised to fix the problem, with Labour campaigning on a pledge to get Britain’s employment rate up from 75% to an unprecedented 80%.
Was the tea lady telling the truth or is it just another one of Labour’s pre election lies? And given that Thieves has raised the cost of employment in her budget I can hardly see the employment rate going up.
“Rachel Reeves, the Chancellor, has promised to fix the problem”
Enoughsaid
I find some stat’ presentations annoying, this article indicated that the employment rate was 74% and fell to 47.9% a drop of 26.1%. Relatively speaking yes, (probably government figures) if you mark the drop against a potential of 100% employment. However an employment figure of 74% of population falling to 47.9% is a drop of 32% in employment. Governments tend to use relative rather than actual. ie, 2 opposed to 1 out of 100 is a relative increase of 100% or 50% reduction between the two readings, however the actual difference against the 100, is technically insignificant.
Honesty seems to be of a low order, but we all knew that, who read here.
“Rachel Reeves, the Chancellor, has promised to fix the problem…”
By increasing the payroll expense – yes Rache’ll fix it.
It isn’t just the will to work it is the will to live. They’ve taken all of the joy out of life. Can’t get married anymore, can’t have sex anymore, can’t own a house. Can’t go travelling abroad or down the pub with your mates or go practicing your favourite sports activities and so even if you had a really good well paid job what the hell are you going to spend it on? You even hear of people in top jobs having to stay at home with parents or having to come to some sort of crappy living arrangement because they can’t even afford to rent. How can you expect morale to be high under such circumstances it’s ridiculous.