
Up to one fifth of all warming reported across the planet by around 20,000 weather stations is invalid due to corruption from non-climatic data. This finding is the latest revelation from two atmospheric scientists seeking to measure the effect of human-caused urban heat on global surface temperature measurements. The news is sensational because it depresses further the major slowdown in warming observed since around 1998. With the global temperature warming by little more than 0.1°C over the last two decades, it makes claims of 4°C warming by the end of the century seem even more implausible.
The latest finding arises from the ongoing work of Dr. Roy Spencer and Professor John Christy of the University of Alabama in Huntsville. The two scientists looked at the 19,885 temperature stations in the Global Historical Climate Network (GHCN) distributed around the world from latitudes 20N to 82.5N. They found that over the last 40 years, virtually all of them had experienced growth associated with human settlement. The global work is said to be at an early stage, but “very preliminary calculations” are said to suggest that urban heat averaged across all stations is about 10-20% of GHCN trends.
Major global temperature compilers such as the U.S.-based National Oceanic and Atmospheric Administration (NOAA) claim to remove urban heat effects by homogenisation techniques, but the scientists say this is unlikely. Abrupt changes in station data can be removed, but they cannot correct “for any sources of slowly increasing spurious warming”. In their latest work, the scientists undertake a critical investigation of NOAA’s homogenisation procedure and astonishingly conclude it is on average “spuriously warming station temperature data trends when it should be cooling them”. The detailed reasons are given in the latest note published by Spencer, where he asks why NOAA adjustments are going in the wrong way? “To say the least, I find these results …. Curious,” he says.
The GHCN forms the core of all the major global surface temperature datasets including the Met Office’s HadCRUT. In the recent past, all these datasets have been subject to considerable upwards retrospective adjustments, and these have largely removed the pauses and slowdown seen over the last two decades. This has enabled further ‘record’ high temperatures to be declared, and the continued Net Zero-helpful promotion of improbable multi-centigrade warming in the near future. Last month, NOAA claimed that the 10 warmest years on record have all occurred since 2010.
In a recently published paper, Nicola Scafetta, a climate research scientist at the University of Naples, noted that the Met Office HadCRUT database had recorded warming of 0.03°C per decade during the hiatus years of 2000-2014. In 2013, Scafetta noted that HadCRUT version 4 increased the warming to 0.08°C per decade. HadCRUT5 further adjusted the 2000-14 figure to supply warming of 0.14°C per decade. A period of pause – a pause that the Met Office actually wrote about – was converted to strong warming. Needless to say, accurate satellite temperature data shows the first pause, along with a current one that is over eight years long.
In their ground-breaking work, Spencer and Christy use a satellite dataset of urbanisation called ‘Built Up’ to determine the average effect that urbanisation has had on surface temperatures. Urbanisation differences were compared to temperature changes from closely-spaced weather stations. Earlier findings suggested that in the last 50 years, there was a remarkable 50% less warming across the eastern United States. Again the work is preliminary and the scientists suggest it is likely to be at the upper limit of de-urbanisation adjustments. Nevertheless, there were many surprises, not least in data from airports. These places contribute many readings to global datasets, but massive distortions were found. One of the worst examples was Orlando International Airport where the warming was measured at 0.3°C per decade. This fell to a de-urbanised figure of just 0.07°C.
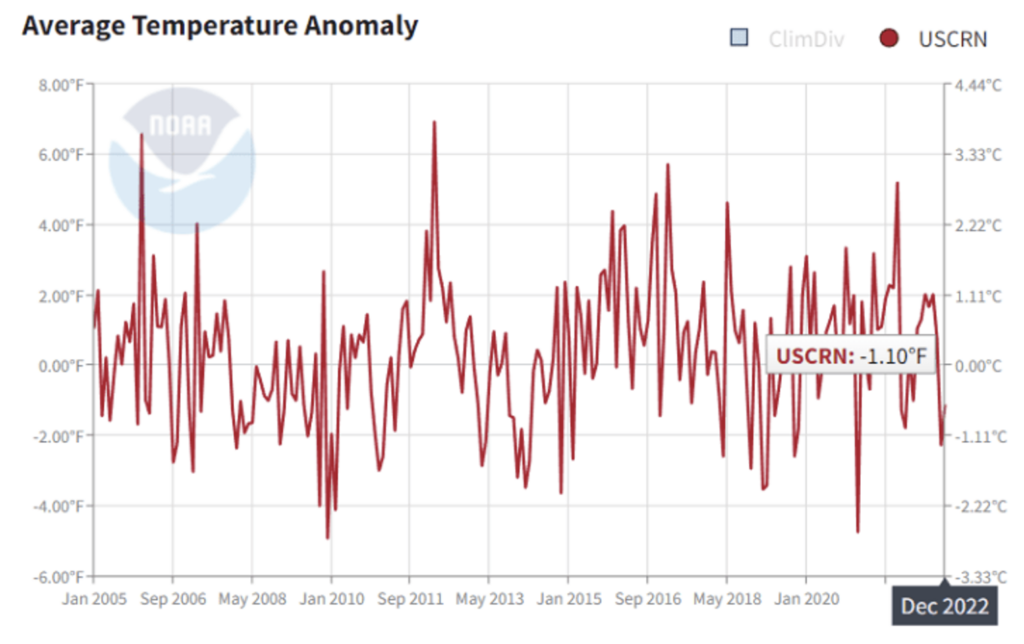
In fact, NOAA does make a serious attempt to track U.S. temperatures away from any urban or human corruptions. A rarely-publicised database is compiled from 114 nationwide stations designed to provide continuous recordings well away from any urban heat distortions. The measurements started in 2005, and to date show little if any warming. It is called the US Climate Refence Network, and the latest graph is posted below.
Intriguingly, the scientists are finding that the strongest urban heating occurs at near-rural sites. Others have noted that the urban heat effect is strongly non-linear with, for example, a 2% increase in urbanisation at rural sites producing much more warming than a similar rise at an urban site. “This means that a climate monitoring dataset using mostly rural stations is not immune from spurious warming from creeping urbanisation, unless there has been absolutely zero growth,” they commented.
There is increasing evidence that surface databases that supply a global temperature are too inaccurate to rely on. Yet they provide bedrock data for collectivists to argue that the climate is collapsing and only a strict political re-ordering of society along Net Zero lines will save the planet from Armageddon. Satellite readings are widely used in climate science but their temperature findings are largely ignored in favour of adjusted and corrupted surface measurements. As regular readers will recall, Dr Spencer is a former NASA scientist and has plotted temperature data from satellites for over 40 years. Last year his blog page providing current monthly readings was ‘demonitised’ by Google Adsense on the grounds of “unreliable and harmful claims”.
Chris Morrison is the Daily Sceptic’s Environment Editor.


To join in with the discussion please make a donation to The Daily Sceptic.
Profanity and abuse will be removed and may lead to a permanent ban.
Garbage in, garbage out!
Who knew?!
The physicist’s dilemma – you can’t observe anything without affecting it.
And yet the amount of money, political capital, power, and reputation that is tied up in the net-zero – climate-change conspiracy is such that a few ‘inconvenient truths’ are not easily going to shift the official line.
I wish this was news. Same story reported by Dr. Roy Spencer and Professor John Christy for years, and by so many other credible people. The list is long. Very long.
Thanks for reporting it anyway.
They can only be ‘top scientists’ if they are the approved for giving right sort of information in support of The Climate Change Narrative™️ – they aren’t.
So nothing they say will make any difference.
The great climate change supertanker is full stream ahead towards our economic ruin with the throttle and rudder superglued in position.
Great choice of image for the post. 😁
I’m just thrilled that Google’s expert climatologists (along with their expert medical scientists, military specialists, geopoliticians and legal eagles etc) are there to keep us all safe from such nefarious information, written by people who only have a measly 40 plus years of experience in their fields of endeavour, only one NASA award for Exceptional Scientific Achievement plus some random Fellowships and Distinguished Professorships. Yes, Google’s crowd can really teach these guys a thing or two about the weather, don’t you think?
Ah, yes, that Global Warming trend that’s been obvious since the Industrial Revolution…
“The world has been chilling sharply for about twenty years. If present trends continue, the world will be about four degrees colder for the global mean temperature in 1990, but eleven degrees colder in the year 2000. This is about twice what it would take to put us into an ice age.”
Kenneth Watt, Ecologist, 1970
This is what I was hearing incessantly as I came of age. There are many more of that period warning us about the “settled science” of the coming Ice Age.
“Confessions of a Computer Modeler”
“Any model, including those predicting climate doom, can be tweaked to yield a desired result. I should know.”
After three iterations [of remodeling] I finally blurted out, “What number are you looking for?”
He didn’t miss a beat: He told me that he needed to show $2 billion of benefits to get the program renewed.
I finally turned enough knobs to get the answer he wanted, and everyone was happy.
Was the EPA [Environmental Protection Agency] official asking me to lie?
I have to give him the benefit of the doubt and assume he believed in the value of continuing the program. (Congress ended the grants in 1990.)”
Robert J. Caprara, “Confessions of a Computer Modeler,”
The Wall Street Journal, 9 July 2014
https://www.wsj.com/articles/confessions-of-a-computer-modeler-1404861351
.
The climate-change industry is making some people rich and powerful so they try to censor any other informations that differs from their claims.