At first sight things look awful in the UK compared to Asia, but there is more to it.

But when we look at testing rates we see why we have found so many new cases. The British are testing like mad!

It's hard to know what is really happening wrt these graphs. Being a middle of the road sort of guy, I'm going to suggest that the important graph is how the purported cases are actually translating into deaths. As the following official government plot shows , the link between detected cases (however we regard the difference between detected PCR cases and the real, significant cases) is broken. It is important to note that cases (as found with the current test processes, no longer has any relevance to predictions of death - the use of "government claimed cases" as a policy tool is undermined as it is apparent that the figure has no effect on human suffering. Could that be vaccine? we do not know)

It is to be hoped that a competent and assertive numbers guy, such as Sajid Javid, can perceive, as we do, the distinction between PCR cases detected and the real, significant cases which do lead to human suffering. Until this distinction is clarified, we will be concerned. However, even SAGE and I am absolutely certain that Regius Prof John Bell is making the distinction clear to ministers incl. obvsly Sajid Javid. This explains how despite (apparently surging cases) the government maintains to stick to the 19 July end date. I feel this time that we will emerge from this crisis with next to no restrictions on that day just 3 weeks hence. It is good that the ignorant cretin Matt Hancock is gone.

This explains how despite (apparently surging cases) the government maintains to stick to the 19 July end date. I feel this time that we will emerge from this crisis with next to no restrictions on that day just 3 weeks hence. It is good that the ignorant cretin Matt Hancock is gone.
Another plot shows that the numerical link beween cases measured (whether real false pcr etc....or not) and deaths is completly cut:

The link is broken. What we're seeing now is background.
Any increases are just a result of community prevalence translating into someone dying who happens to be infected. Its the "with" not "of" again.
Very roughly, if 1% of the population has SARs2 then you'd expect 1% of people who die to also have it regardless of cause.
Roughly 1600 people die a day in the UK.
If 1% of the country currently has SARs2, you'd expect 16 deaths a day just by chance "with not from" it.
Taking into account lag and case rise it looks like the hospital admission and death graphs are showing pretty much that - tracking background rates and nothing more.
Zero death average is impossible with the insane "28 days after a test" metric we use for that reason.
The link is broken. What we're seeing now is background.
Roughly 1600 people die a day in the UK.
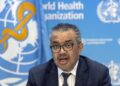
Robert Dingwall, the sensible bloke on SAGE says
Covid as an endemic, respiratory infection is really just like all the other 30 or so respiratory infections that humans have coexisted with forever, and that we shouldn’t be doing anything exceptional in relation to it
The link is broken. What we're seeing now is background.
Taking into account lag and case rise it looks like the hospital admission and death graphs are showing pretty much that - tracking background rates and nothing more.
The last plot above is from Zoe and is hence it not spoiled by questions over PCR veracity.If newcases were really running at 10,000 per day at the start of June, more than enoughtime has elapsed for those to either recover or die, deaths are running at around 15 or so per day. Giving an ifr of 0.15%, which I recognise and which is not completely false.